Explains how values are calculated on the Consumption chart in the Wattwatchers web dashboard
The consumption chart shows a summary of the site which is the addition of all devices on the site. For the Consumption chart to work, your device must be installed with a 'Grid connect and/or 'Solar generation' channel.
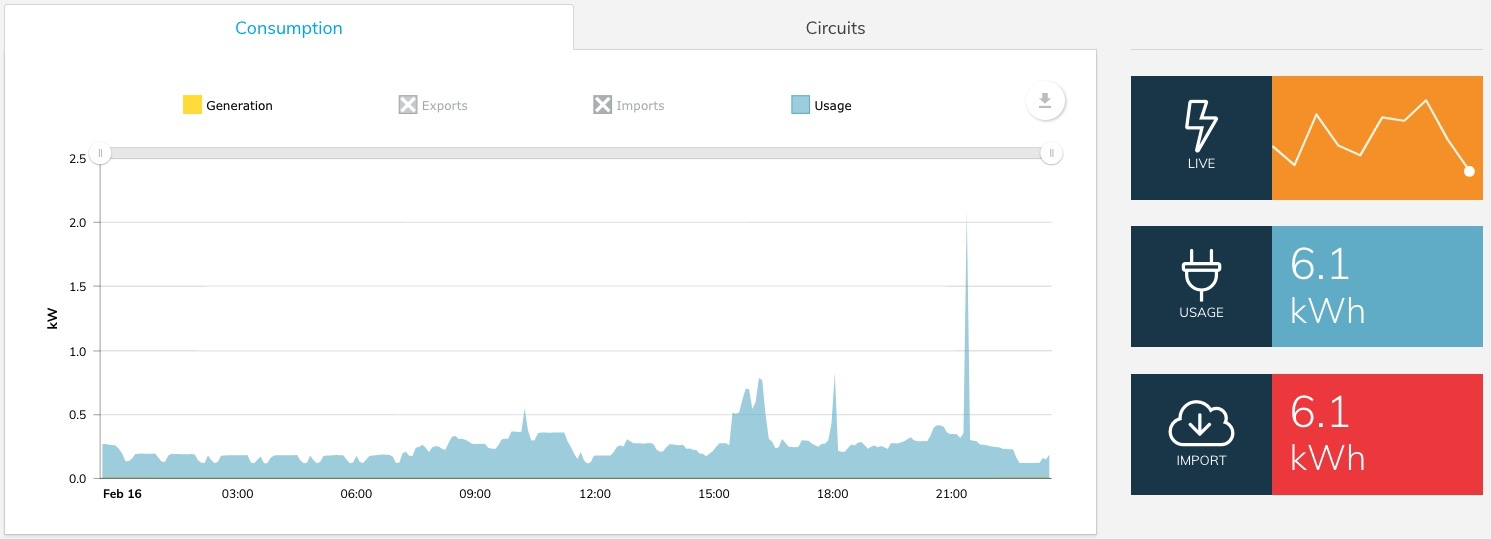
Consumption tab in the web Dashboard
If the Consumption chart is not working:
- You may not have a grid connection or solar - view data in the circuits tab.
- The device is not configured correctly - contact your installer to have the settings changed in the Onboarding application the installer uses.
- Usage/consumption
- Imports
- Generation
- Exports
- Multiple Auditors in a site
Usage/Consumption
Usage is the sum of your 'Grid connect' + 'Solar generation' channels. When you are exporting (putting energy back into the grid), this equals 'Solar generation' minus Exports. When you are importing (drawing energy from the grid), this equals “Solar generation” plus imports.
Imports
Imports are electricity drawn from the grid. Any positive values on your “Grid connect” channel(s) are considered “Imports”.
Generation
The total of all solar generation from your panels.
Exports
Any negative values on your 'Grid connect' channel(s) are considered 'Exports'—electricity that is put back out to the grid.
This configuration assumes your system is configured in a Net Metering arrangement.
In a 3 phase system, all three channels must be configured with the correct channel category ('Grid connect' or 'Solar generation').
Multiple Auditors in a site
To provide an accurate overview of a site Auditors are summed together and displayed in the chart. For example, if you have multiple Auditors on the site:
- 'Grid Connect' channels will be summed together
- 'Solar Generation' channels will be summed together