Download The MyEnergy App for your smart device
-png.png?width=266&height=79&name=pngwing-com%20(4)-png.png)

The app is freely available to download through the app stores but an installed device and username and password are required to use the app.
- Get your device installed - Once you have purchased a device, you will arrange the installation of a Wattwatchers Auditor device by a licenced electrician.
- Download the app Download the MyEnergy app from the link above.
- Register your device For residential customers, you can self register your device within 30 days of installation. Read the title 'Registration' below to find out how or click here.
Full Comprehensive User Guide For The MyEnergy App
Need help or more information?
This Application User Guide is based on version 1.8.0 of the MyEnergy application and will be updated regularly. There may be some differences in appearance between different devices and versions of the application. Please always ensure you have the latest version installed by checking your app store for any updates.
What is the MyEnergy App?
MyEnergy is the Wattwatchers mobile application for Apple iOS and Google Android devices that provides intelligent real-time energy management for homes and small businesses that have a Wattwatchers device installed.
MyEnergy also provides options for you to securely share your energy data with third-parties that you authorised, so you can access energy management tools, offers and applications. MyEnergy is part of a broader energy marketplace project that will be continually updated with new partners and offers as they become available.
Registration
Important Note
If you have already received your username and password by email, please skip this section and go straight to the Logging In section.
In order to access your data in the MyEnergy app, you need to register your device with your contact and address information. In some circumstances this may be completed for you as part of the installation process, in others you will need to self-register your device as soon as it is installed.
If you have more than one Wattwatchers device at your site, please contact your installer or log a ticket with Wattwatchers support so that all of your devices can be correctly assigned to the same site.
Note that only one user can complete the self registration process for each device installed and it must be completed within 31 days of your device being installed. Otherwise you will need to log a ticket to get your account set up manually or for any complex sites with multiple devices.
The registration process is a three-step process to
- Verify your device;
- Register your account; and
- Register your site.
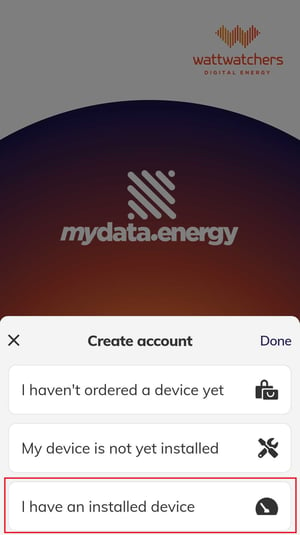
Open the MyEnergy app and tap on the Get Started button and then select the I have an installed device option. 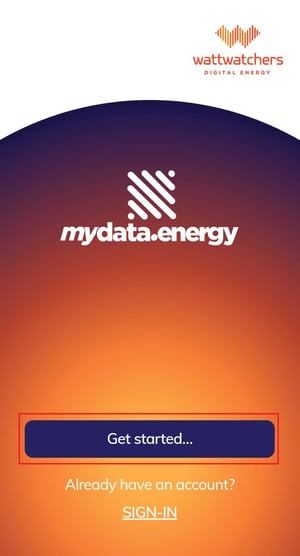
For the next step to verify your device, you will need your device serial number.
This is the number such as D D941 0826 2461 that will be provided by your installer. It should also be visible on a label where your device is installed.
The serial number is also on the cardboard box for the device, if that has been provided to you. If you don’t have your serial number, please contact your installer to confirm.
Verify device
In the Verify device page, enter your Device serial number into the text entry field. You do not need to enter any spaces and it will be automatically formatted for you.
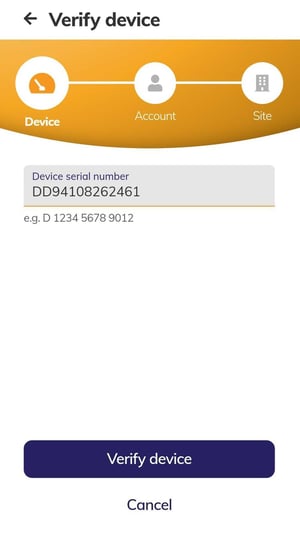 Tap on the Verify device button to continue to the next step.
Some additional information about your device will be displayed to confirm that the serial number you entered is the correct one. If these details look incorrect, please confirm the serial number has been entered correctly or confirm with your installer..
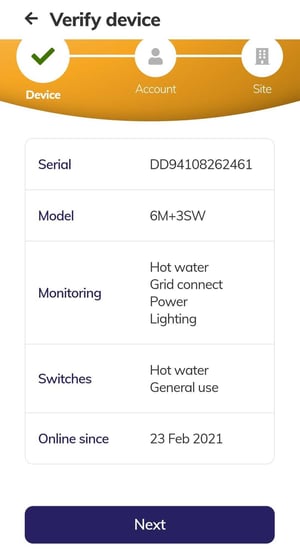 Tap on the Next button at the bottom of the page to proceed to the next step. If you can’t see the “Next” button, swipe up until it is visible.
Register your account
On the Register your account page, enter in your name and email address information as prompted.
Enter the password you would like to use, noting the special security requirements for a valid password.
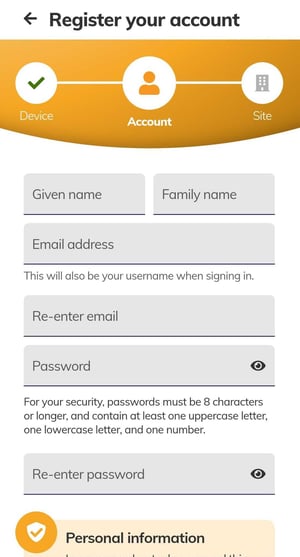
Passwords must be at least 8 characters long and contain:
- at least one uppercase letter, and
- at least one lowercase letter, and
- at least one number
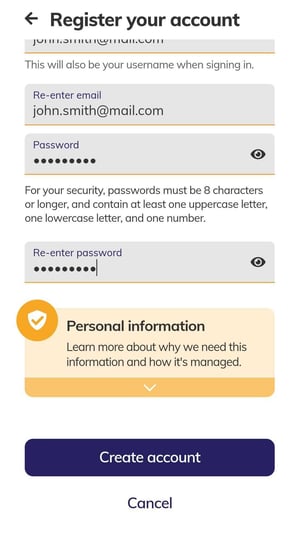
If any issues in the account information are identified, these will be indicated with a red alert icon and a message about the changes required.
Once all details have been entered, tap on the Create account button at the bottom of the page to proceed to the next step.
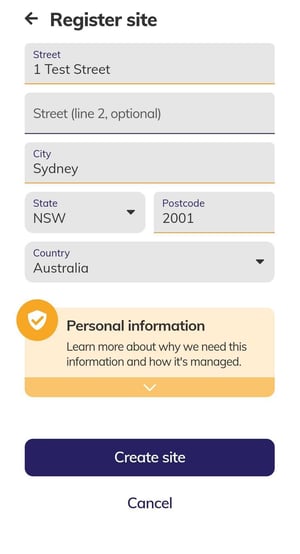
Register site
In the Register site section, enter a name for your home, such as “Smith Home” and then fill out the address information as prompted.
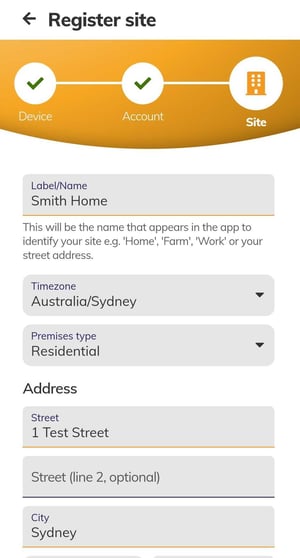
Swipe up and tap on the Create site button at the bottom of the page to complete the registration.
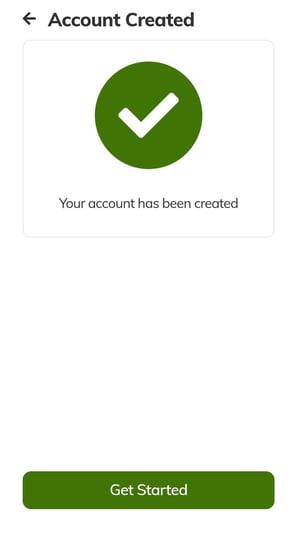
Your account will be created and you can tap on the Get Started button to be automatically logged in to access your energy data.
If you see any errors during the account creation process, please log a support request at https://service.wattwatchers.com.au/kb-tickets/new
Logging In
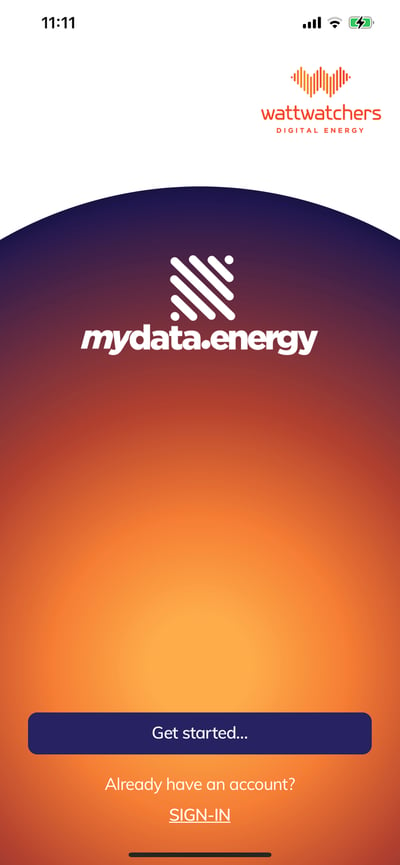
Start the app and the welcome screen will be displayed. Tap on the SIGN-IN button at the bottom of the screen.
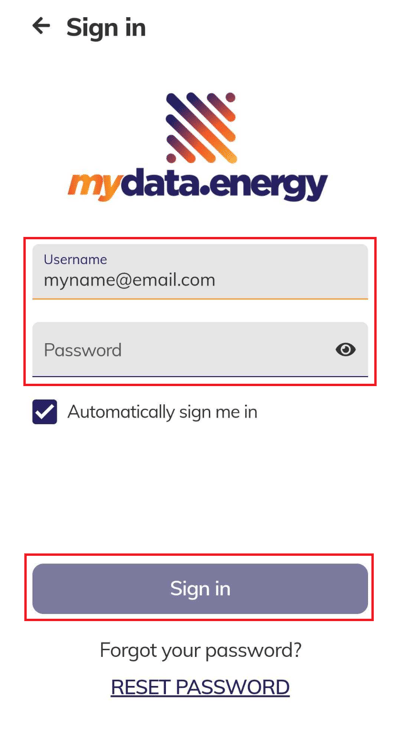
Enter your username and password and tap on the Login button or the GO button on your keyboard.
Resetting your password
If you forget your password, you can use the RESET PASSWORD link at the bottom of the Sign in page to get back in.
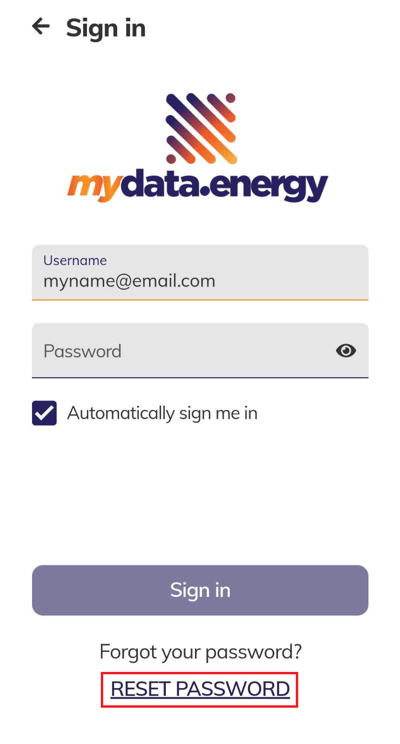
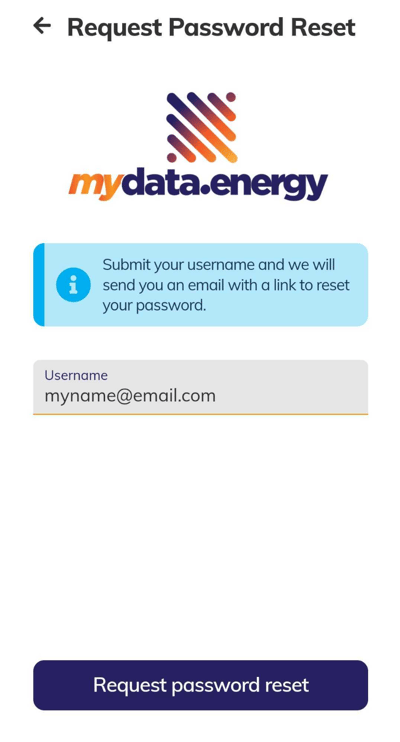
Tap on the RESET PASSWORD link under the Sign in button and then enter your email address. Then tap on the Request password reset button and a link will be sent to your email address to reset your password. Follow the prompts to update your password and log back in.
Navigating the application
Navigation of the MyEnergy app is separated into sections by the icons at the bottom of the screen.
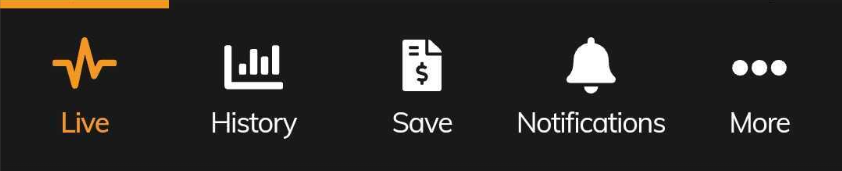
- Live - displays real-time information on electricity consumption and solar generation.
- History - access charts of your usage, grid and solar generation over time.
- Save - upload an energy bill to compare your rates and see if a better deal is available and mange your energy budget notifications.
- Notifications - list of notifications such as budget alerts or offers available.
- More - select different sites and devices, change your password and access information on how to get support.
The current selection is highlighted in orange with a bar at the top (e.g. the “Live” section is highlighted in the screenshot above) and you can change the selection at any time by tapping on the icons.

Some headings at the top of the screen also indicate an arrow that allows you to navigate back to the previous screen and these can be tapped on at any time.
Live
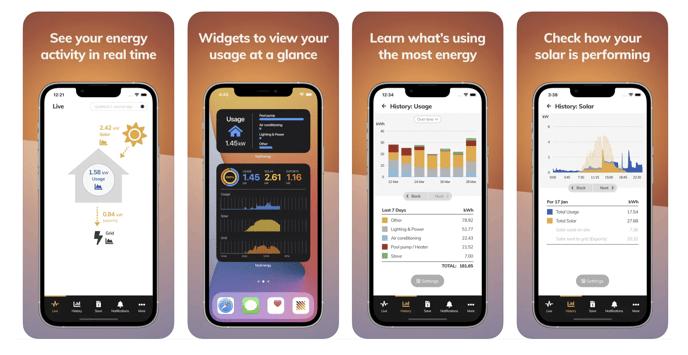
The Live screen displays real-time information on the energy being used in your household and solar generation updated every 5 seconds.
If you look at the Live screen while you turn appliances on and off around your home, you can see the impact they have on your total energy usage.
In the example below, these are shown as flows of energy into the house from the solar system at the top of the screen, usage within the house in the middle of the screen and any imports (energy you draw from the grid) or exports (energy you are sending to the grid) at the bottom of the screen.
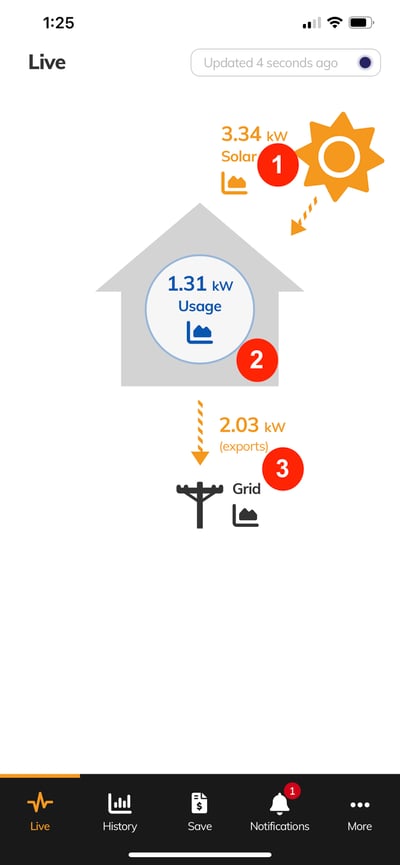
In the screenshot above:
- The Solar value indicates the system is currently generating 2.92 kW.
- The Usage value inside the house indicates the amount of energy being used in the house by all appliances, lighting etc. In this example, the house is consuming 1.01 kW.
- An orange arrow pointing away from the home indicates that energy is being sent to the grid. A dark grey arrow pointing towards the house indicates the flow of energy is into the home, from the grid. In this example, the 1.91 kW of solar that is not used in the home is being exported to the grid.
The solar information is not displayed if a solar system has not been configured during the installation process.
The values on the Live screen are updated every 5 seconds when the app is running. The top right of the screen displays a live timer, which counts up to the next update.
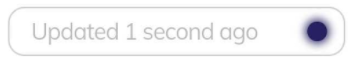
This fast-data feature requires your device to have good signal strength and a reliable connection to the internet, and that occasionally some real-time updates may not be received by the application.
There also is a slight delay when you first open the app while the device goes into the fast reporting mode, so it’s a good idea to wait for one or two updates to make sure the fast values are being received.
Note that on some devices, you may need to swipe up to see the refresh timer status message.
Below the Live display, if the device is switching-enabled you may select whether selected circuits are ON or OFF.
You can turn each switch on and off by touching the toggle switch on the right hand side of each label.
See more information on switches in the Switches Control section.
Live pop-up windows
On the Live screen, any item with a small chart icon (see below) can be tapped on to see more information about that part of your energy profile.


Solar pop-up window (sites with solar only)
The solar pop-up window displays a single bar chart that shows how much of your household usage is being supplied from your solar system at the current point in time. The relative areas of the orange solar and blue usage sections indicate how much of the solar generation is being self consumed at your site.
Think of this as a “slider” that shows visually the proportion of energy being generated vs. used or exported.
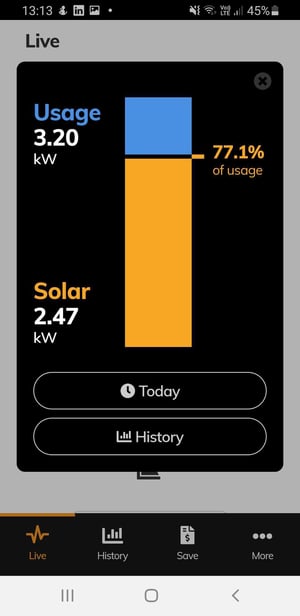
In this example, 3.2 kW is being used by appliances in the house, and the solar system is generating 2.47 kW. This means that 77.1% of the household usage is being supplied from solar and the remaining 22.9% is being supplied from the grid - though this second percentage value is not shown on the chart.
As the usage is more than the solar generation, the solar generation is shown as a percentage of the usage.
The chart changes when there is more solar energy being generated than is being used, with the excess exported to the grid. In this case, the total solar energy being exported to the grid is shown with the orange section at the top of the section of the chart and the blue usage in the lower part.
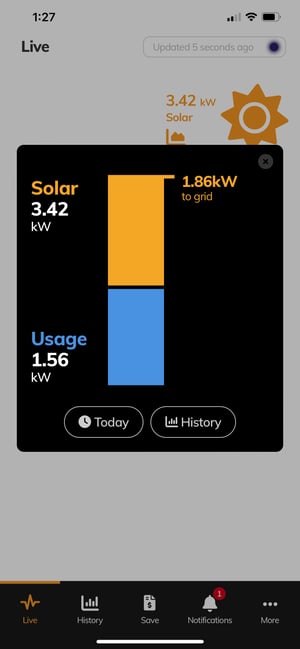
In the example above, the solar system is generating 3.42 kW and the usage in the house is 1.56 kW. This results in 1.86 kW being exported to the grid.
The Today and History buttons provide shortcuts into the History section of the app. Please refer to the History section in this guide for more information.
Tap on the Today button to see the detailed charts of the solar generation for the current day.
Tap on the History button to view the detailed charts of the solar generation for the last 7 days.
Tap outside the pop-up or on the X icon in the top right corner to close this pop-up window.
Usage pop-up window
The Usage pop-up window displays the amount of power being used in the house in at the present moment. The total power in kW are shown on the left hand side. On the right-hand side of the window are horizontal bars indicating the proportion of energy being used by the top 4 energy categories.
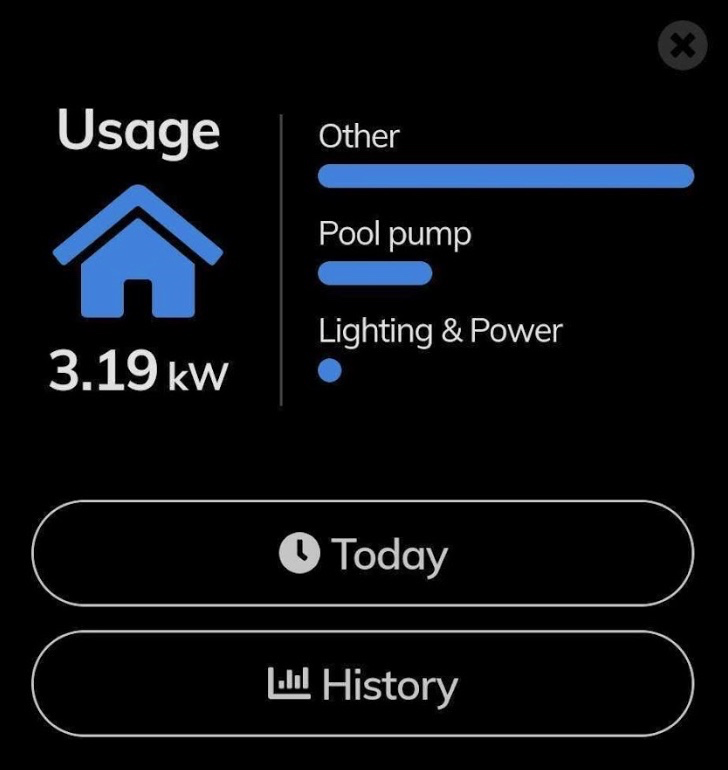
In the example above, the current amount of power being used in the house is 3.19 kW, and around 70% of that is from the “Other” category, 25% from the Pool Pump category and the remaining 5% is from the Lighting & Power category.
The Today and History buttons provide shortcuts into the History section of the app. Please refer to the History section in this guide for more information.
Tap on the Today button to see the detailed charts of the usage for the current day.
Tap on the History button to view the detailed charts of the usage for the last 7 days.
Tap outside the pop-up or on the X icon in the top right corner to close this pop-up window.
Grid pop-up window
The grid pop-up window displays information on the current usage and the total imports from or exports to the grid.
The top section displays the information about what is happening right now in the house, represented as a gauge showing if the house is consuming or exporting energy to the grid. The green left side of the gauge indicates energy is flowing to the grid, and the blue right side indicates if energy is being consumed from the grid. This gauge will scale depending on the current amount of usage or grid export.
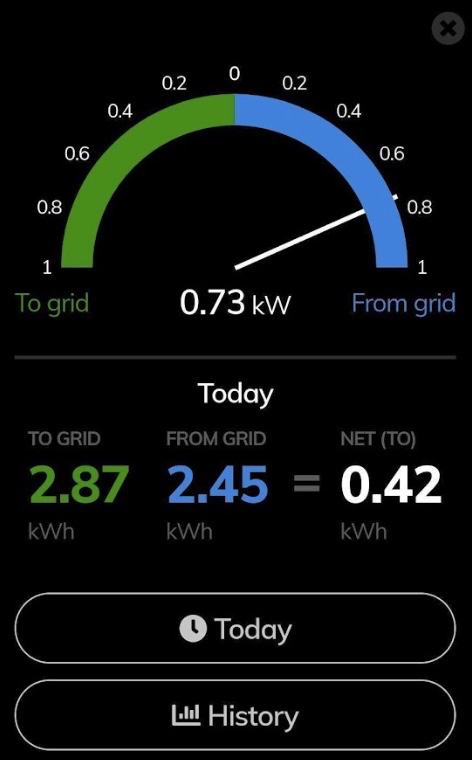
The bottom half of the grid pop-up-window shows the total for today (since midnight in your device's local time) of the export to grid and usage from grid with a net value in kWh. This indicates if the total amount of solar generation is higher than the consumption from grid (NET TO) or lower (NET FROM) for the current day.
The Today and History buttons provide shortcuts into the History section of the app. Please refer to the History section in this guide for more information.
Tap on the Today button to see the detailed charts of the grid usage for the current day.
Tap on the History button to view the detailed charts of the grid usage for the last 7 days.
Tap outside the pop-up or on the X icon in the top right corner to close this pop-up window.
History
The History section provides access to detailed charts of the usage, grid and solar generation over a period of time.
The History page provides three main options to give the user access to the following:
-
Solar - see how much your solar system has been generating and how much it has been offsetting your grid usage. Note this option is only displayed for sites that have solar generation monitoring configured during installation.
- Usage - see how much electricity your key appliances and circuits have been using as a summary and over time.
- Grid - see how much electricity you have been using from the grid and how much solar energy has been sent to the grid.
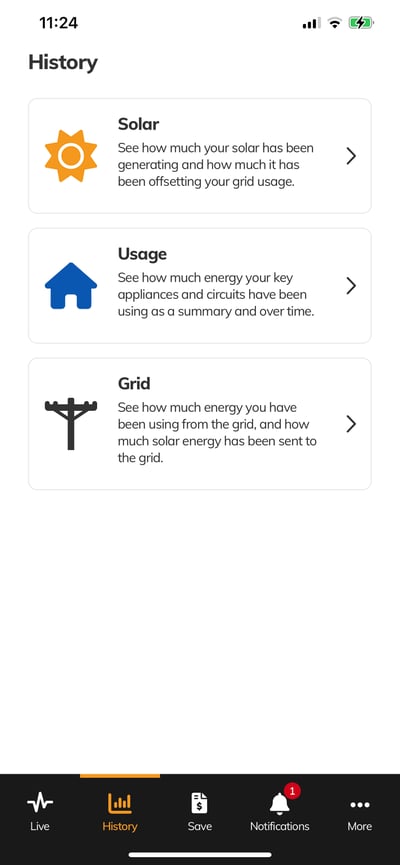
Tap on any of the panels to see the detailed charts as described in the following sections.
Solar
Not seeing this feature?
This section is only available for sites that have been installed with solar generation monitoring.
The Solar History charts let you see how much your solar system has been generating and how much it has been offsetting your grid usage.
Different date periods can be selected from a single day to many months to see the variation of the total solar production, self-consumption and excess energy exported to the grid.
The following colours are used for all Solar charts:
- Blue indicates the total consumption for the period (day or month)
- Dark/solid orange indicating Solar used on site (self-consumption)
- Light/transparent orange indicates Solar generation sent to the grid (exported).
Tap on the Settings button and select the desired period to display the Solar charts.
The default view will display the Last 7 Days as a bar chart and note that the total height of stacked dark and light orange bars indicates the total Solar production on that day.
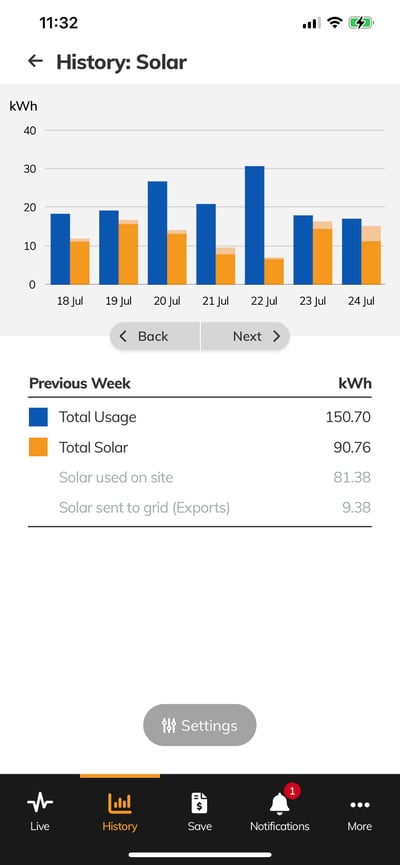
The following features are illustrated in the example above:
- The average daily energy consumption (blue) of the property varies from just under 20 kWh to just over 30 kWh.
- Solar production (orange) from the 18th to the 26th of July was around 10 to 15 kWh per day.
- On days with good solar production, the solar production (orange) is far greater than the total consumption (blue) and around half of this is being exported to the grid (light orange).
The table below the chart provides the total amounts in kWh of the Usage, Solar sent to grid (exported to grid) and Solar used on site (self-consumption) for the date range selected.
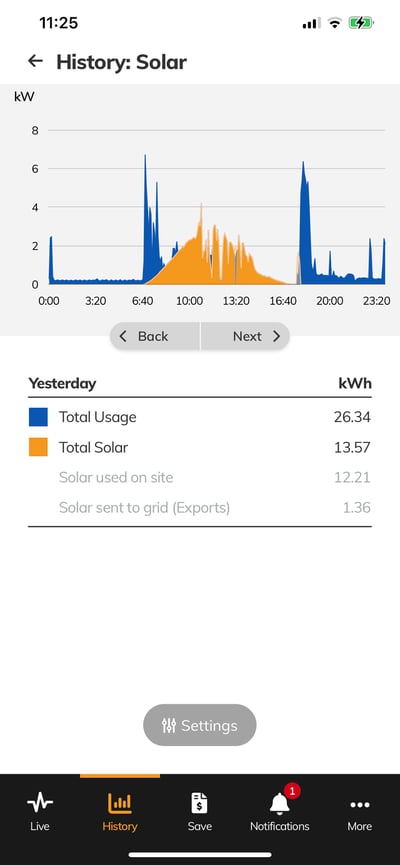
When viewing the usage for a single day, more detailed line charts are shown (as depicted below). Tap on the Settings button and set the period by selecting the Start Date and the End Date.
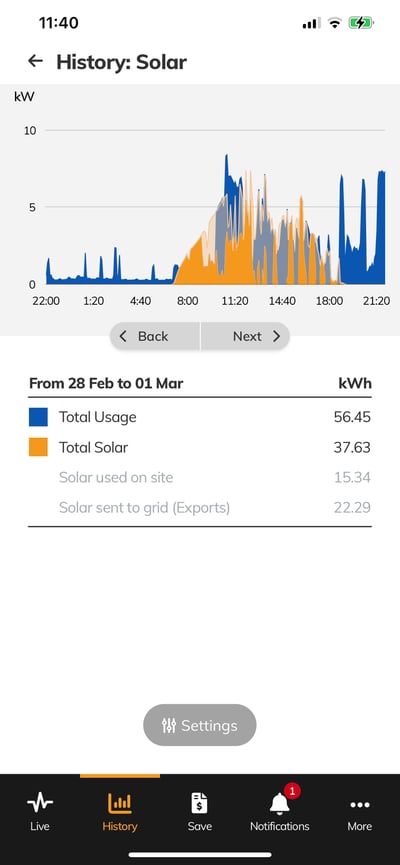
In the single-day Solar History example above the following features are illustrated:
- The total solar generation (dark and light orange) followed the traditional bell-shaped curve and peaked at around 7 kW.
- All daytime consumption was supplied from solar generation (dark orange).
- The total load is represented by the dark blue graph.
The table below the chart provides the total amounts in kWh of the Usage, Solar sent to grid (exported to the grid) and Solar used on site (self-consumption) for the day selected.
Note that due to the limited screen space on mobile devices, the detailed line charts are only shown for periods of up to 24 hours - such as the Today and Yesterday options or a Custom date range for a single day. For all other charts, a bar chart is shown for longer periods of time.
Usage
The Usage charts let you see how much energy your key appliances and circuits have been using, both as a proportional summary (pie chart) and over time (stacked bar chart).
Tap on the Settings button and select the desired period to display the Usage charts.
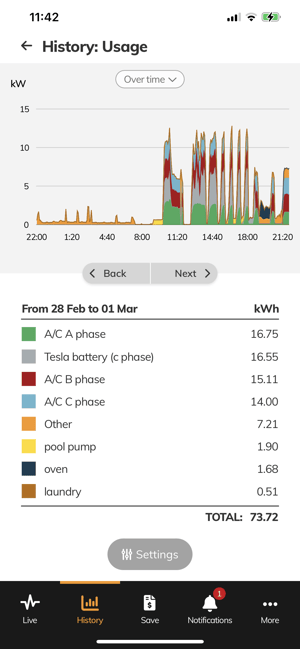
Usage over time
The default view will display the Last 7 Days and each group of appliances is given a colour in the stacked line or stacked bar chart. The total height of each bar indicates the total consumption for that day.
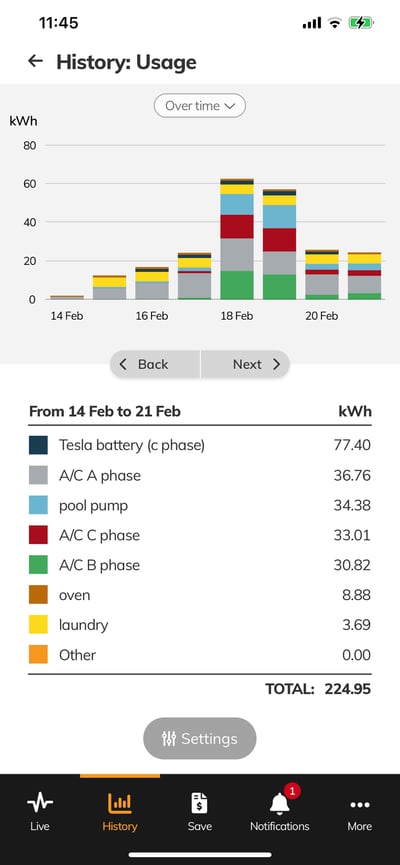
In the example above, it is possible to observe the following features based on the size of each coloured segment:
- The daily Pool Pump (light blue) usage is pretty consistent each day. This may indicate it is running on a timer for the same amount of time each day (tip: you can use the app to guide you on resetting timers as seasons and daylight hours change through the year).
- The Lighting and Power (grey) usage varies substantially each day, which suggests that one or more significant loads are used irregularly (in this case, Lighting & Power includes electric vehicle charging that is not used every day or at set times).
- The Other (orange) usage is somewhat consistent each day, but does not vary as much as the Lighting and Power (grey) usage.
The Other usage values are calculated based on the total energy use of the sites minus the circuits that are being monitored directly. This means that Other energy is not categorised and may be a mixture of circuits and appliances.
The table below the chart provides the total amounts in kWh of each group of appliances for the date range selected.
When viewing the Usage History for a single day, the stacked line chart is shown. Tap on the Settings button and set the period by selecting the Start Date and the End Date.
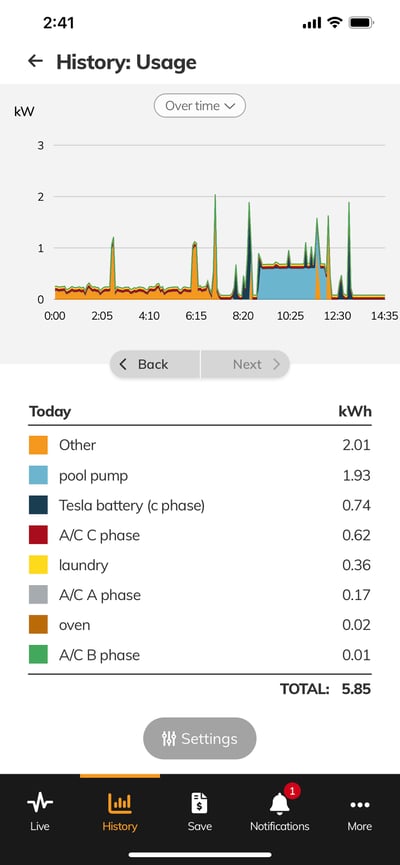
The “Today” Usage History example above illustrates the following features:
- Between midnight and 8:30 am, there was very little energy consumption, which is expected for most residential properties while people are sleeping and most appliances are switched off. The small amount of base usage will generally be from always-on appliances like fridges and freezers and devices that are in standby mode.
- The Pool Pump (blue) turned on at approximately 8:30 am and consumed a little less than 1 kW (800 W to 900 W) while running.
- There were intermittent spikes in the Other (orange) consumption throughout the day.
The table below the chart provides the total amounts in kWh of each appliance group for the day selected.
Note that due to the limited screen space on mobile devices, the detailed line charts are only shown for periods of up to 24 hours - such as the Today and Yesterday options or a Custom date range for a single day. For all other charts, a bar chart is shown for longer periods of time.
Usage Breakdown
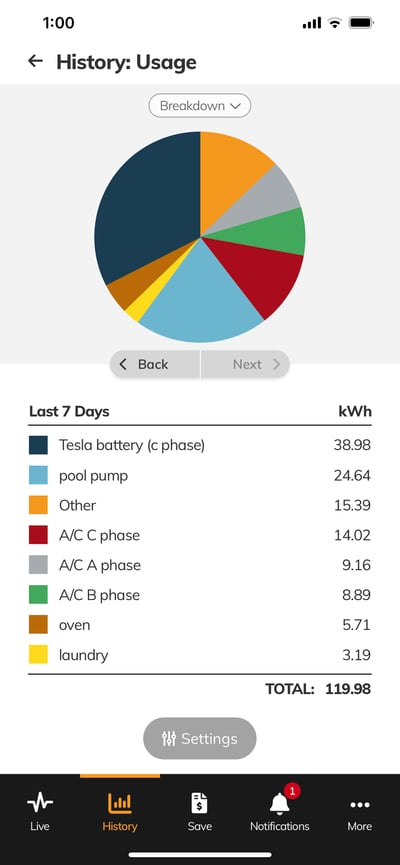
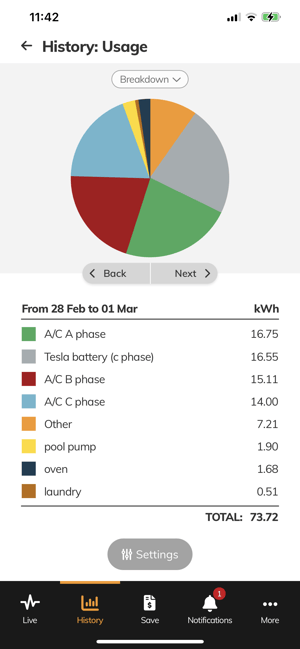
The Usage Breakdown displays a pie chart breakdown view to help see this for the selected date range.
The default view will display the Last 7 Days and each group of appliances is given a colour in the stacked line or stacked bar chart. The total area of each section indicates the total consumption for that appliance group.
The History Usage Breakdown allows you to understand which groups of appliances have been used the most over the selected period of time. This may be useful for identifying and reducing the usage of your largest appliances or to understand how the energy consumption is divided up for the property.
Tap on the Settings button and select the desired period such as Today, Yesterday, or a Custom date range to view the Usage Breakdown over a selected period of time.
Grid
The Grid charts let you see how much energy you have been using from the grid and how much excess solar energy has been sent to the grid.
Different date periods can be selected from a single day to many months to see the variation of the energy used from the grid (imports) and excess energy sent to the grid (exports).
The following colours are used for Grid charts:
- Grey for energy used from the grid (imports)
- Green for excess energy sent to the grid (exports).
Tap on the Settings button and select the desired period to display the solar charts.
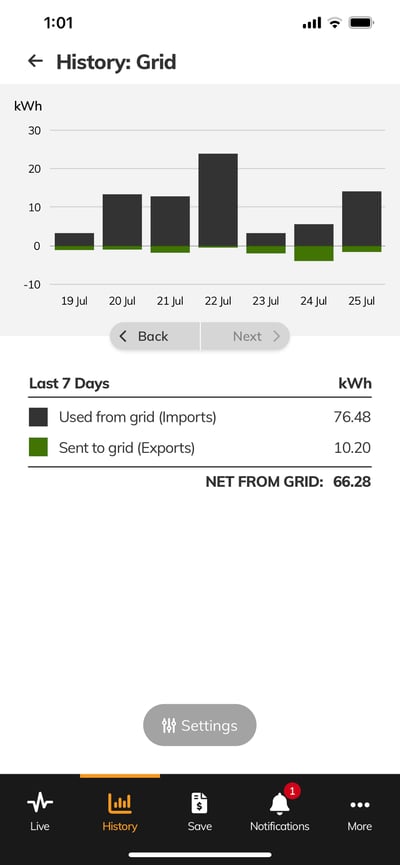
The default view will display the Last 7 Days as a bar chart with positive values for energy used from the grid (imports) and negative values for excess energy sent to the grid (exports) on that day.
Note that for households that don’t have solar, there will be no green energy bars, as there is no energy to be sent to the grid.
In the example above we can observe, based on the size of each coloured segment:
- The total energy used from the grid (grey) varied from as low as 5 kWh up to more than 20 kWh per day.
- The excess energy sent to the grid (green) on the 24th of January indicates good solar production and low self-consumption.
For sites where the energy used from the grid is greater than the excess generation sent to the grid, this is shown in the summary table as NET FROM GRID.
When viewing the Usage History for a single day, a line chart is shown. Tap on the Settings button and select the desired period such as Today, Yesterday, or a single Custom day to view.
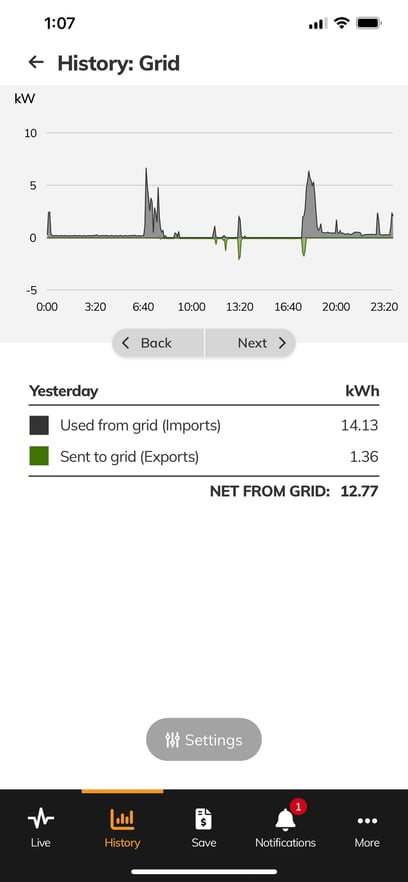
In the single-day Grid History example above, it is possible to observe the following features:
- There was a small amount of consumption between midnight and 8 am.
- The load of the house increased substantially at around 4.40 pm.
Tap on the Settings button and select the desired period such as Today, Yesterday, or a Custom date range to view the Usage Breakdown over a selected period of time.
Note that due to the limited screen space on mobile devices, the detailed line charts are only shown for periods of up to 24 hours - such as the Today and Yesterday options or a Custom date range for a single day. For all other charts, a bar chart is shown for longer periods of time.
History Chart Settings
When viewing any of the History charts, each chart has a Settings button at the bottom of the screen that allows you to select the period of time to display on the graph.
Note that you may need to swipe up to see the Settings button on some devices.
Tap on the Settings button to see the options that are relevant for each chart. Note that some charts may have different options to others.
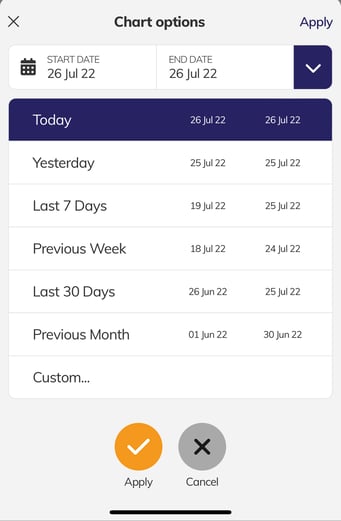
Most charts will show a set of shortcuts for quickly selecting the date range that you would like to see in the chart:
- Today - the data for today from midnight up to the most recent data point.
- Yesterday - the data for yesterday from midnight to midnight
- Last 7 Days - the data for the last 7 days
- Previous Week - the data for the week before the current week (i.e. 14 to 7 days ago)
- Last 30 Days - the data for the last 30 days
- Previous Month - the data for the month before the current month (i.e. 60 to 30 days ago)
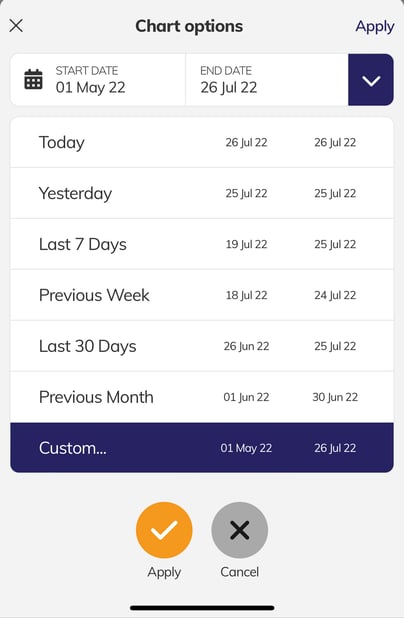
- Custom - enter a specific start date and stop date to display.
For Custom date ranges longer than a month, the data is displayed as a total for each month.
If these preset options are not displayed and the Custom date selection is displayed, tap on the downward-facing arrow icon next to the dates
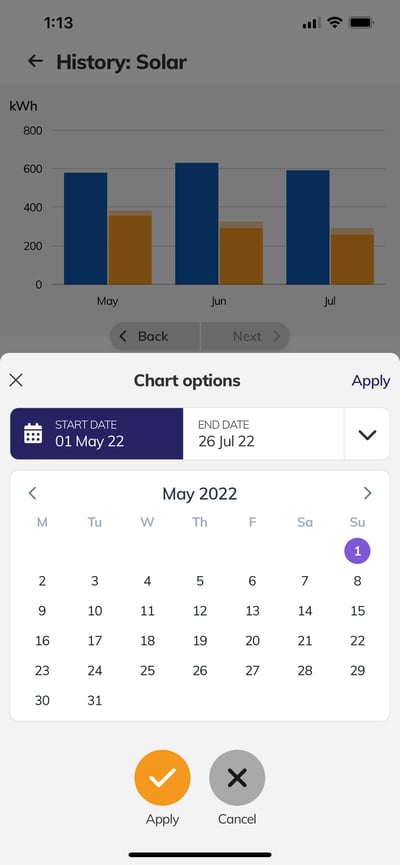
If you tap on the Start Date, End Date or the Custom option, a calendar selector will appear to choose the Start Date and End Date.
Depending on which option was selected, the Start Date or End Date field will be highlighted in blue at the top of the screen to indicate which date the calendar picker below is changing. Tap on the Start Date or End Date to swap between them.
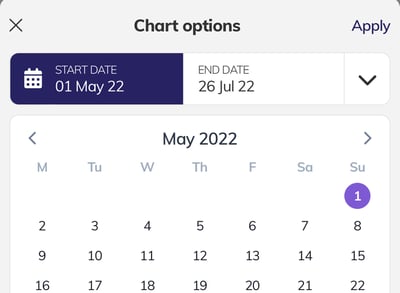
First tap on the Start Date and use the following steps to choose the first date of data you want to. Then tap on End Date and repeat this process.
You can navigate through different months by tapping on the < or > buttons on either side of the month name.
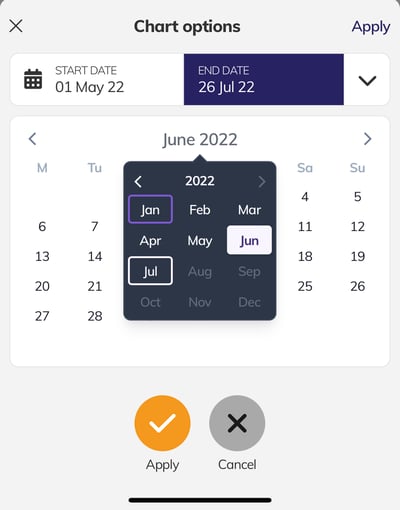
To directly select a specific Month, tap on the month name and select the desired month from the abbreviations (Jan, Feb, Mar, etc).
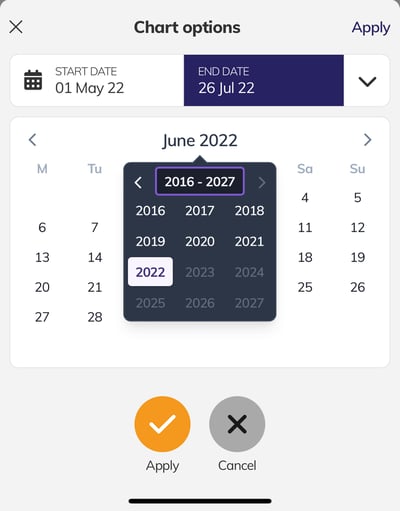
To directly select a specific year, as per the previous step, tap on the month name and then tap on the year and a year selection box will appear.
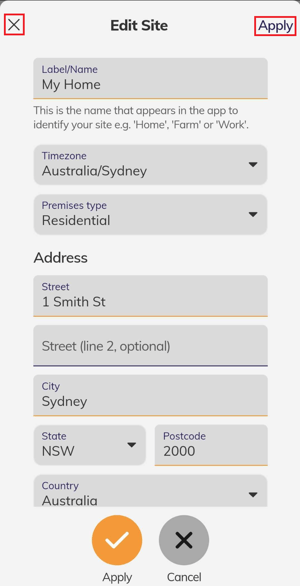
Tap on the desired date range option and then tap on the Apply button to view the data. Note that on smaller screen devices the Apply and Cancel buttons may be out of view. If so, swipe up to bring them onto the screen.
Tap on the Cancel button to return to the previously displayed data.
Save
The Save section allows you access the Electricity Plan Comparison and Energy budget features.

Electricity Plan Comparison
The Electricity Plan Comparison section allows you to upload your energy bill to compare your existing energy provider with other providers’ rates and see if a better deal is available.
Not seeing this feature?
Note that some features of the Save section may not be available for sites managed by some Wattwatchers partners.
To use this feature, you will first need to download a PDF of your electricity bill onto your mobile device, which may be from your email or your retailer’s website. Remember to note down the name of the PDF file as this will be required later when you search for the file to upload it via the app.
When you first use the Save function in the app, you will need to follow the steps to Upload your bill.
If you have already uploaded your bill previously, then you can continue or restart this process from the View your results section.
Upload your bill
Information on how to upload your bill is provided on the screen. Tap on the Upload bill button to search for the file on your device.
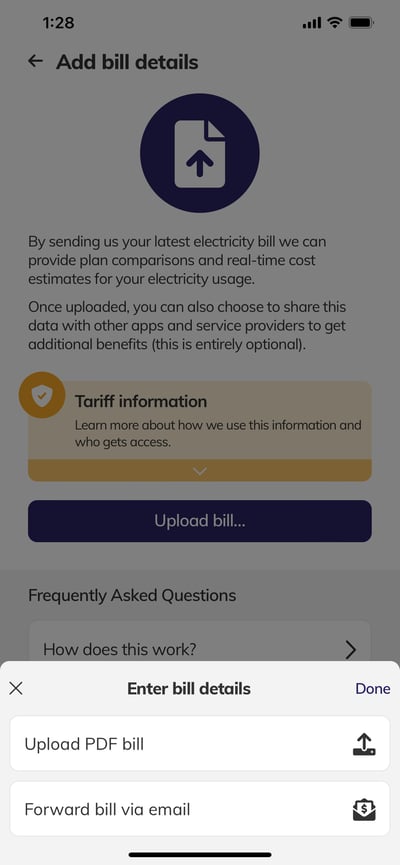
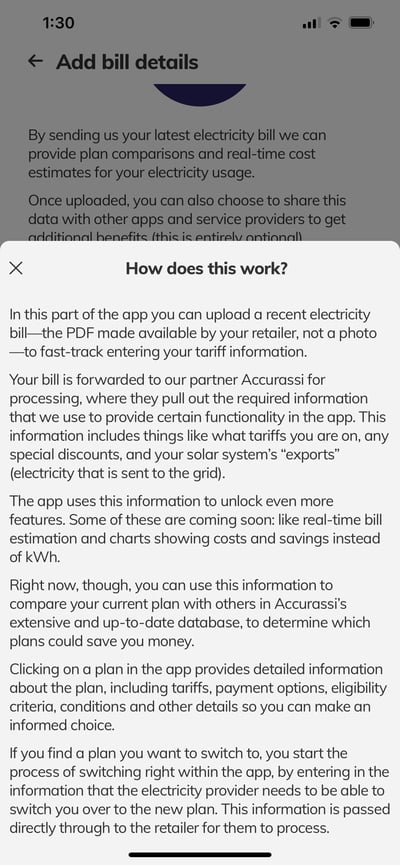
Swipe up on the Upload Bill screen to see some additional information in the Frequently Asked Questions section. Tap on any of the questions to see the response.
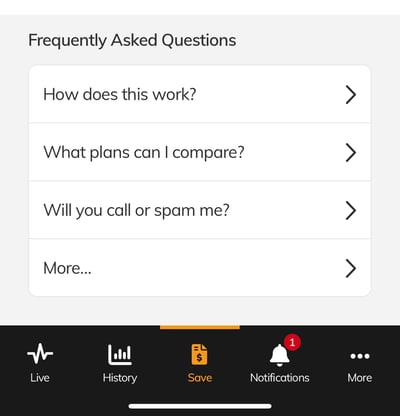
Each answer is displayed in a pop-up and can be closed with the X button in the top left corner.
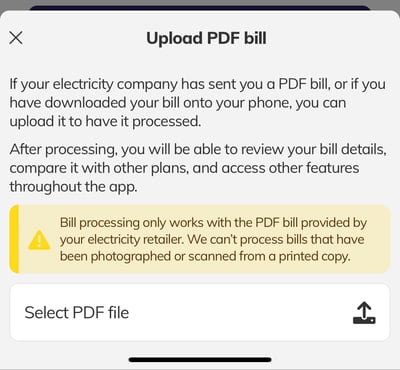
When you tap on the Upload bill button, a pop-up is displayed with some additional information.
Tap on the Select PDF file button to open the file search window for your device.
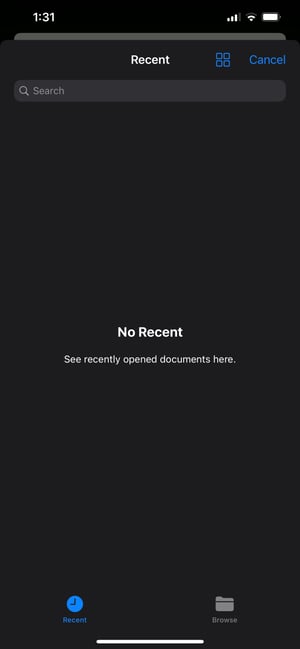
Apple iOS devices
On an Apple iOS device, the view will default to your Recent files. Navigate to the location where you have saved your PDF file and select it.
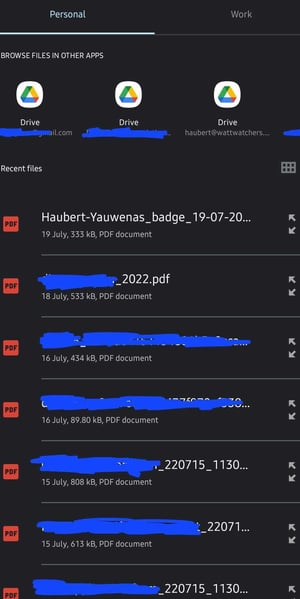
Google Android devices
On a Google Android device, the view will default to your Recent files. Navigate to the location where you have saved your PDF file and select it.
View the results
Once you have successfully uploaded your bill, an indication if you can save money will be displayed. Based on the results from a list of plans from participating retailers, there may be multiple opportunities to reduce your future power bills.
Note that the following examples with specific offers and rate information is shown for reference only and may be different from offers currently available in your area.
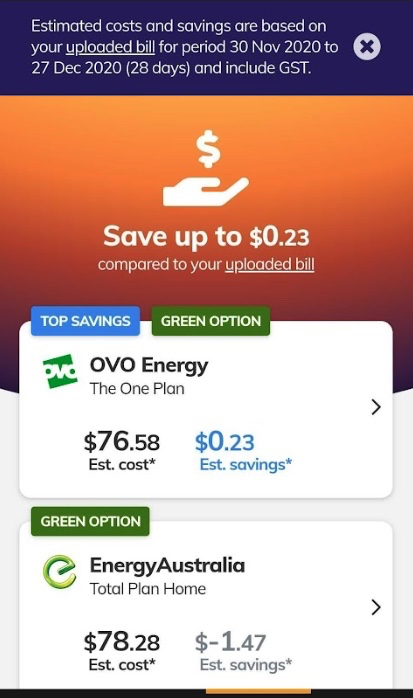
Tapping on any of the plans will display more information on that plan to allow you to review it in more detail. In this example, we will continue to review the first offer in the list.
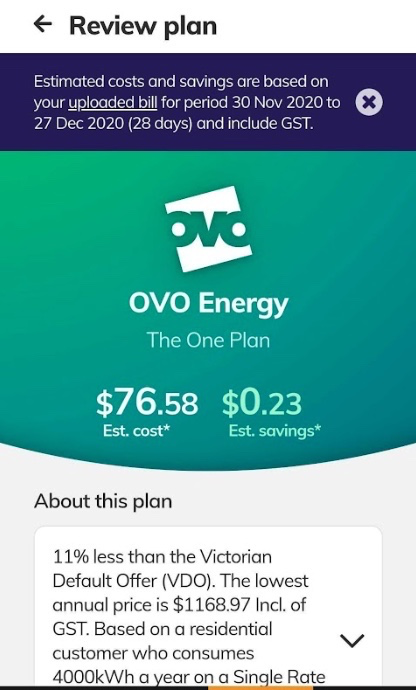
Swipe up to see more information on this energy plan and tap on the arrows to expand sections and see more detail including any rates, green power, solar feed and any other special information or requirements.
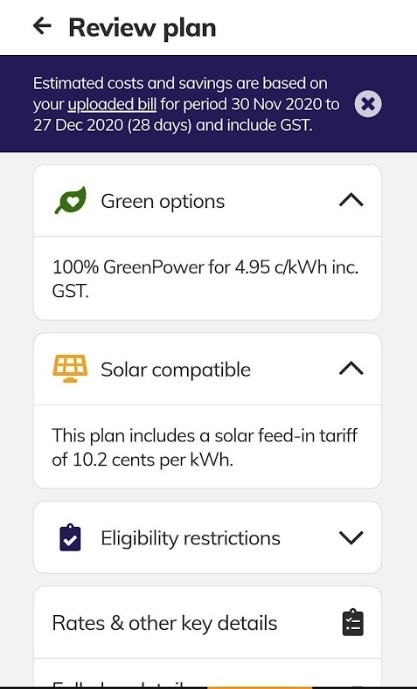
Tap on the Rates & other key details button to see the specific tariff information for the plan.
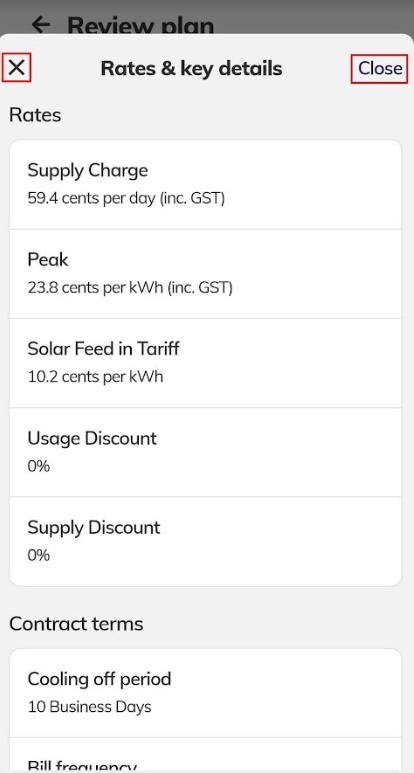
Tap on the X icon in the top left corner or the Close button in the top right corner to close the detailed information pop-up.
See more information
After reviewing the available offers, if you want to start the process to accept it, at the bottom of the results review plan page is the Go to retailer website button.
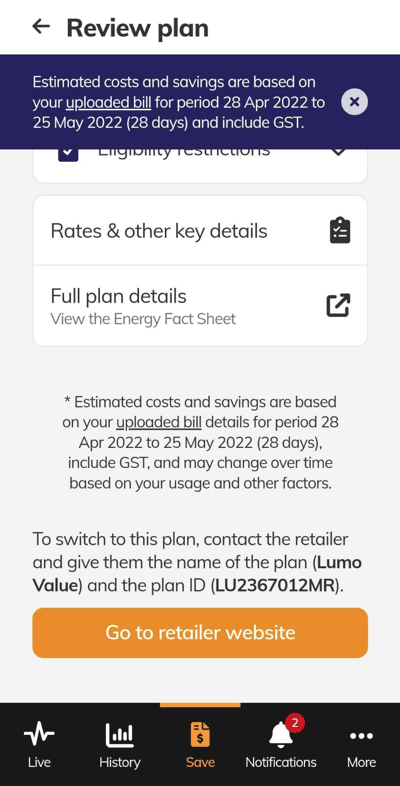
Tap on the Go to retailer website to sign up directly on their website or contact them for more information.
Uploaded bill information and restarting the comparison process
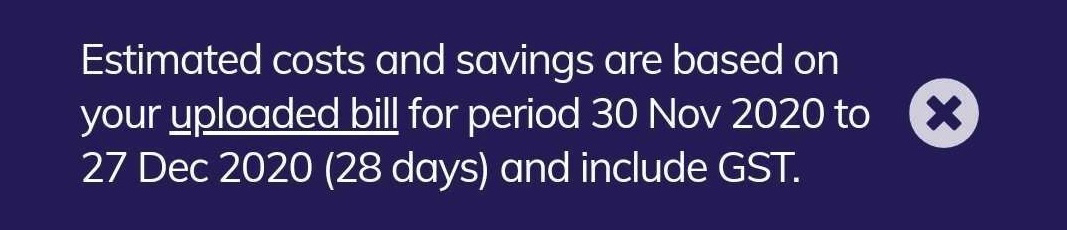
At the top of the Save results page is a message with information from the uploaded bill. Tap on the uploaded bill link to view more information on the uploaded bill or tap on the X icon on the right side to acknowledge and close this message.
If you tap on the uploaded bill link in the message at the top or bottom of the screen, then the information on the Current bill details is displayed, including the billing provider, period and total bill amount.
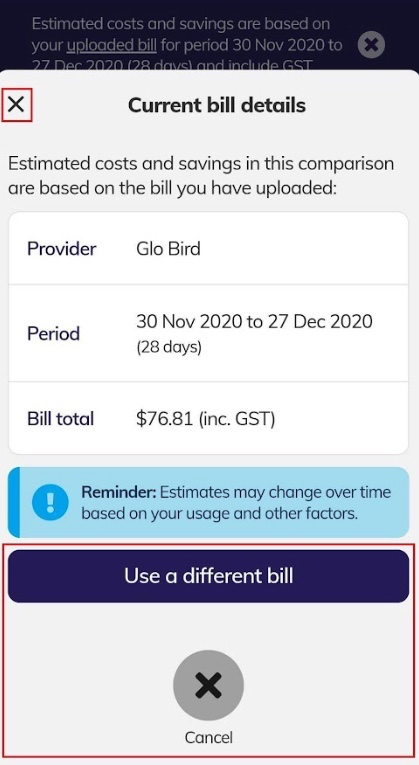
Tap on the X icon in the top left corner or the Cancel button at the bottom to close this pop-up.
Tap on the Use a different bill button to restart the Upload your bill process with a different bill.
Energy Budget
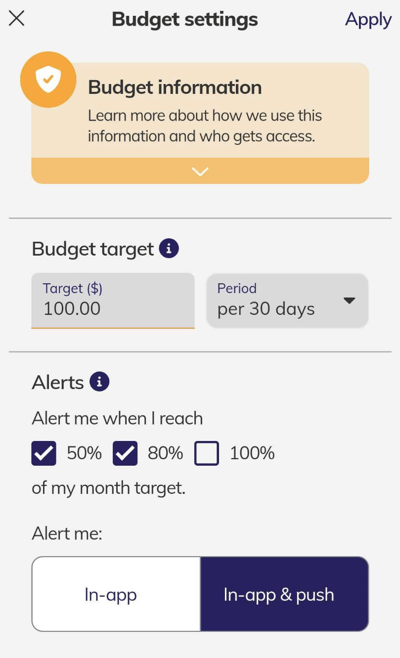
The energy budget tool has been added to the ‘Save’ section to allow you to set up any limit you wish to follow for your energy usage. There is also the option to receive push notifications to warn you as you approach the predefined budget limit. To access these details, you need to select the ‘Settings’ icon.

In the Budget settings, there are several headings:
- Budget target - Set a target amount of AUD$ that you would like to stick to over a given period of time (daily, monthly, yearly)
- Alerts - An alert can be selected for when you reach 50%, 80% or 100% of your budget target.
- Alert me - The notifications preferences to either an In-app or In-app & push notification. For more information on alerts and notifications, please see the Notifications section.
- Billing - Select your chosen retailer (if applicable), billing frequency, and end of last billing period.
- Tariff details - You also need to provide details regarding the standard tariff, fixed charge, and feed-in tariff in order for the budget calculation to be accurate

- Controlled loads - You may select a controlled load if applicable (e.g. pool pump), and this will need an associated controlled load tariff.

Once you reach the end of the Budget settings, select the tick to save your responses or the cross to return without saving.
Notifications
Notifications are alerts or messages from the MyEnergy app such as reaching your energy budget limit or offers from Wattwatchers and our partners on ways to use and share your energy data.
In the Notification Centre, you will see a list of all your notifications – or a friendly message to let you know you currently have no notifications.
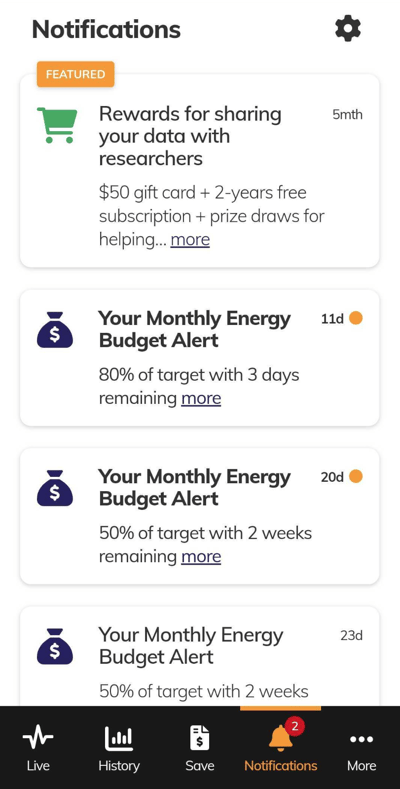
Unread notifications stand out from ones you’ve read before by the bolder font and the orange dot on the right hand side of the notification card. The time since the notification was received is also displayed with a number and h (hours), d (days) or mths (months).
Tapping the ‘more’ link in a notification’s summary text expands it to show the full message and an action button. In the example below, the upper card is expanded so the View budget button is visible, and the lower card is in the compressed state with the more link shown.
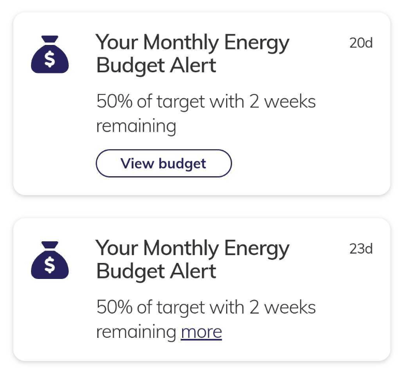
Tapping the action button—which will be labelled according to the action you’re taking. In the example above, the ‘View budget’ button takes you to the relevant Save screen in the app, or to a website (e.g. for the alert about this blog post).
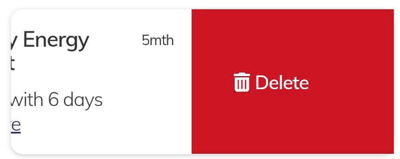
Swipe left on a notification to delete it.
Tap on the gear icon in the top right corner to access the notifications preferences.

The notification types include the following:
- Blog notifications - links to articles from the Wattwatchers and partner websites and blogs.
- Budget notifications - alerts from the Energy Budget features relating to your energy consumption and cost estimates.
- Offer notifications - opportunities to share your energy data and get rewarded in the process.
The the notifications can be set to the following options:
- None - no notifications. This option does not apply to the Budget option as this is enabled only if the Budget feature is used.
- In-app - show notifications in the MyEnergy Notifications page.
- In-app and push - show notifications in the MyEnergy Notifications page and the system level notifications.
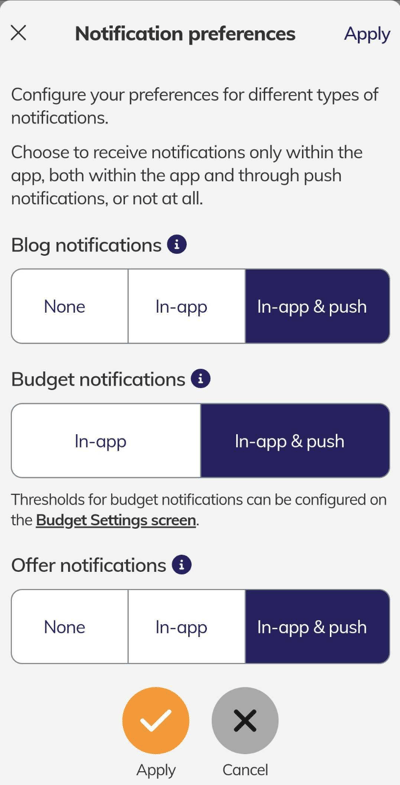
Tap on the Apply button to save the notification preferences or click on the Cancel button to return to the notifications page.
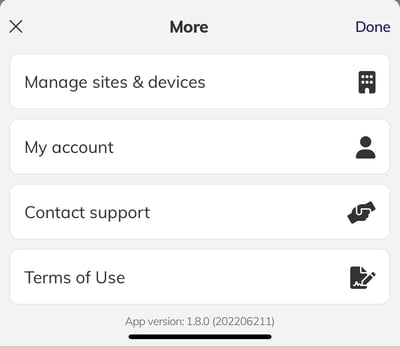
More
The More menu allows you to change sites and devices, change your password, and also provides further information on how to get support.
Tap on the More button at the bottom of the screen to display the pop-up menu that provides the following options.
- Manage sites & devices - if you have Wattwatchers devices installed at multiple premises, you can access them and switch between them here.
- My account - allows you to change your password, sign out or delete your account.
- Contact support - contact our support centre for any troubleshooting.
- Terms of Use - view the current version of the terms and conditions.
Manage sites & devices
Tap on the Manage sites & devices button to view and switch to display the data for other sites and devices that you have access to.
Most residential users will only have access to a single site and a single device. In some circumstances, access to multiple sites and devices may be available. An example might be if you have a second device installed in a sub-board at your home (such as for a garage or granny-flat); or a business user may be managing multiple properties.
Tap on the site name in the black box to select sites you have access to. The list of sites will then pop up for selection.
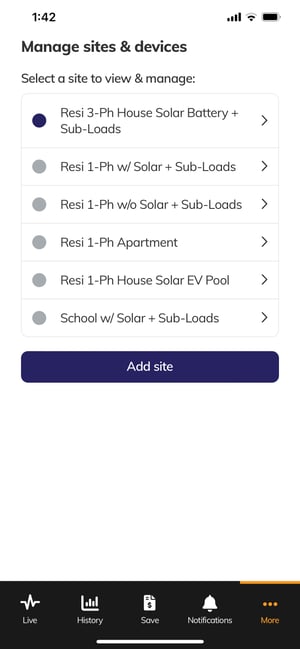
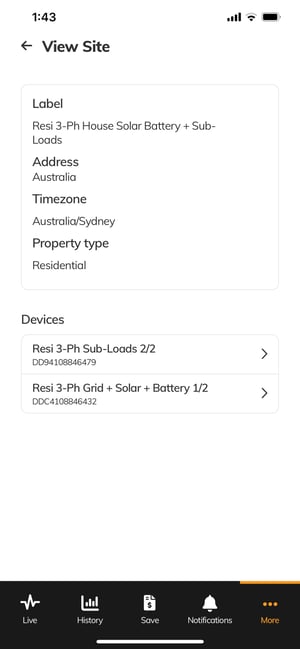
The current site is shown with a dark blue circle icon. Tap on the site name to view the site information.
If you completed the self registration process and you are the account holder, you will have access to the Edit button in the top right corner of the View Site page. Tap on the Edit button to change the details associated with your site.
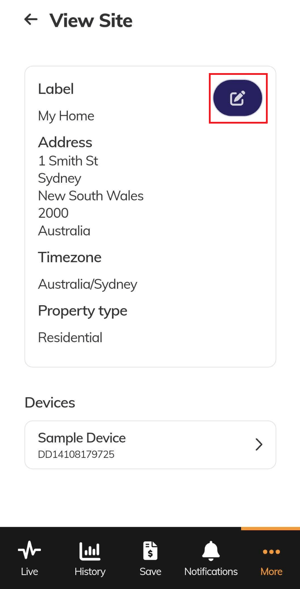
The Devices section at the bottom of the View Site page shows a list of devices installed at that site is displayed with the device name and device serial number. Tap on the Device Name to view more information about that device.
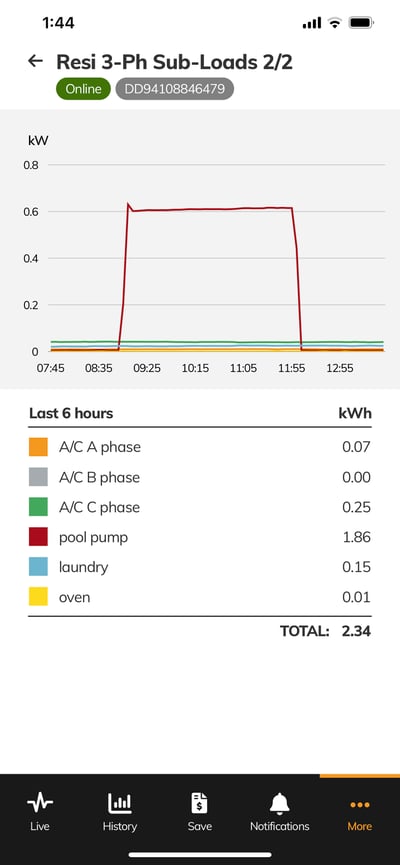
Last 6 Hours Chart
The Device Information screen provides a chart and table for the last 6 hours of usage. This provides slightly more detailed information than the History charts over a fixed period of time and also displays the individual circuit names the device was configured with during installation.
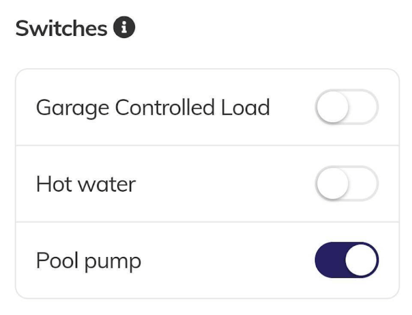
Switches Control
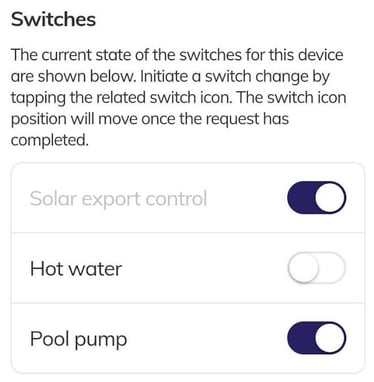
For sites where a device with the switching option has been installed, the switches can be accessed by swiping up to view more below the Last 6 hours table.
Each switch name is displayed with the current state of the device shown by the toggle switch position. A toggle switch position to the right (with dark colour) indicates the switch is on and a toggle switch position to the left (with light colour) indicates the switch is off.
Switch on ![]()
Switch off ![]()
Some switches are displayed with the name in grey text to indicate these can not be controlled by the user for special cases such as the Solar export control functions which are reserved for the equipment operator (such as an electricity network or demand response provider).
My account
The My account page provides access to change your password, sign out and delete your account.
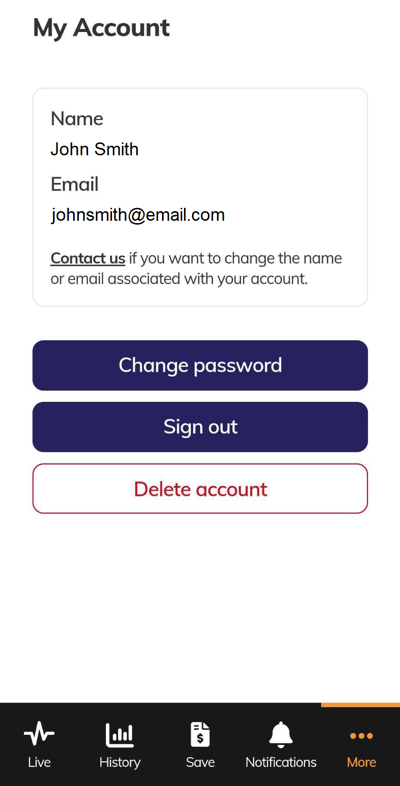
Change password
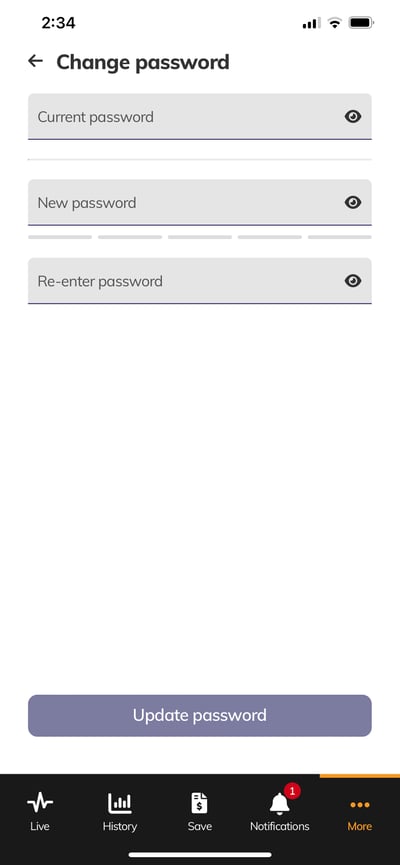
The Change password button allows you to change your password to a new value with the following steps.
- Enter your current password into the Current password field
- Enter a new password in the New password field noting that the new password must comply with the security requirements displayed on the page.
- Enter the same new password into the Re-enter password field.
- Tap on the Update password button.
If there are any issues with the password, such as not meeting the security requirements, the password is not changed and you can repeat the process with a new password.
Changing your password does not log you out of the application.
Sign out
Tap on the Sign out button to exit the application and return to the Log In screen.
Delete account
The Delete account button allows you to remove you account from Wattwatchers systems. Tap on the Delete account button and a confirmation pop-up appears to confirm this critical action.
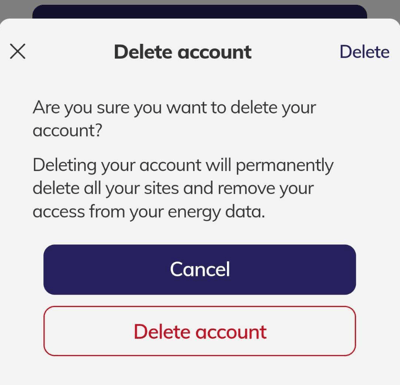
Tap the Delete account button to remove your account and sign out or tap on Cancel to return to the My Account page.
Contact support
This feature allows you to log a support ticket directly in the MyEnergy app. Tap on the Contact support button to enter a subject line, and an empty message section to describe the issue. The ‘From’ section is automatically filled with the logged-in user, but this can also be edited as required.
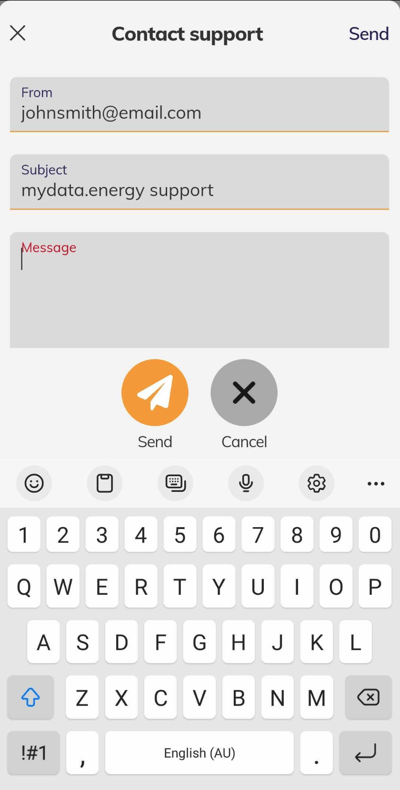
Tap on the Send button to log the support request or tap on Cancel to return to the More menu.
Terms of Use
The Terms of Use option provides access to the current terms and conditions of the MyEnergy app.
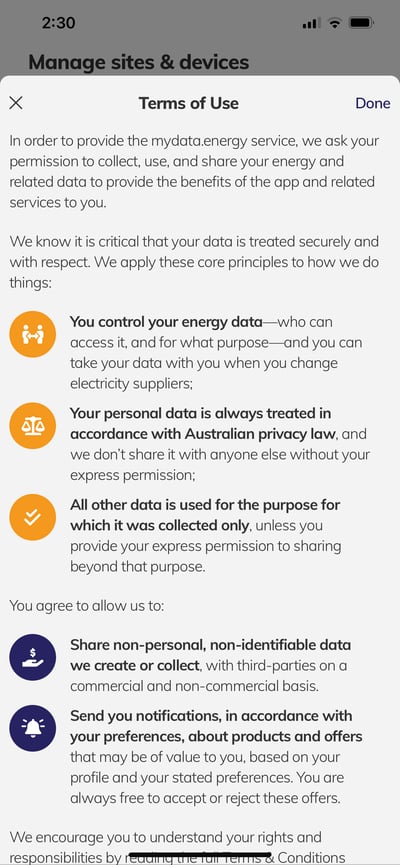
Tap on the X button in the top left corner or the Done button in the top right corner to close the pop-up window.
The current Terms of Use are also available at https://mydata.energy/terms
Widgets (iOS only)
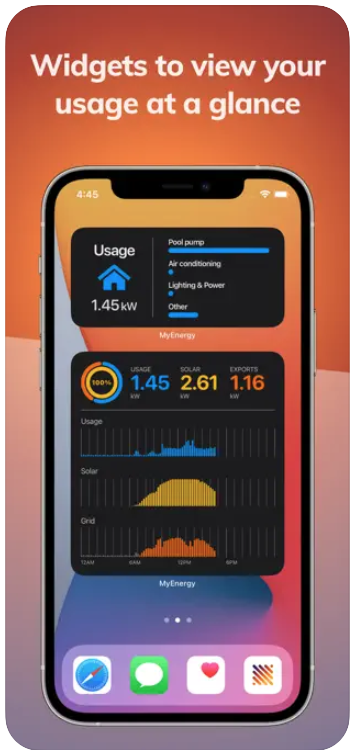
Widgets show you current information from the MyEnergy app at a glance. You can add widgets to your Home screen or the “Today” view (when you swipe all the way to the left) to keep this information at your fingertips.
You can also tap on different parts of the widgets to quickly open the MyEnergy app to see more detailed information.
Not seeing this feature?
Note that widgets are currently only available for Apple devices with iOS 14 or higher.
Adding widgets
Add widgets to your Home Screen
- From the Home Screen, touch and hold a widget or an empty area until the apps jiggle.
- Tap the Add button (grey plus icon) in the top-left corner of the screen.
- Select the MyEnergy widget from the list of application widgets.
- You will be presented with a list of 6 widgets—3 different sizes for Solar and Usage.
- When you see the widget option that you want to add on screen, tap Add Widget button.
- Tap Done.
Add widgets to Today View
- Touch and hold a widget or an empty area in Today View until the apps jiggle.
- Tap the Add button (grey plus icon) in the top-left corner of the screen.
- Swipe up to select the MyEnergy widget.
- Swipe left or right until the widget you want to add is visible.
- Tap Add Widget, then tap Done.
See the Apple support article Use widgets on your iPhone and iPod touch for more information.
Adding widgets for multiple sites
By default, the site that is active in the app when you add your first widget is selected. See the Manage sites & devices section for more information on accessing multiple sites.
If you have access to multiple sites, you can change the site that a widget displays by:
- Touch and hold a MyEnergy widget and then tap on Edit Widget.
- Tap on Site and Select the site from the list.
Solar widgets
Small solar widget

The small solar widget shows information about your solar generation in relation to usage.
The solar generation is shown as an inner ring (yellow) and the value in the centre indicates the percentage of usage that is being supplied by your solar generation. This value will be 100% when the solar is generating excess energy that is being sent to the grid.
The outer ring shows the relative amount of usage (blue) and any export to the grid (orange).
The current values of the solar generation and usage values in kW are shown at the bottom of the widget
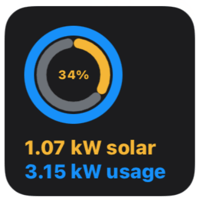
These values and colours also change when the solar generation is less than the total energy required.

When the amount of usage is more than the solar generation, the additional energy imported from the grid (grey) is shown in the inner ring as above. The percentage value in the centre of the rings indicates how much of the usage is being provided by the solar generation. The usage ring (blue) moves to the outside so that the inner ring represents the amount of solar (yellow) plus import from the grid (grey) relative to the usage ring.
Tap anywhere on the small solar widget to open the MyEnergy app Live screen.
Medium solar widget
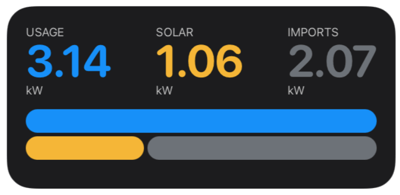

The medium solar widget shows information about your solar generation in relation to usage.
The top half of the widget shows the current values in kW for usage (blue), solar generation (yellow) and exports to the grid (orange).
The bottom half of the widget shows bars to indicate the relative usage (blue), excess solar generation exported to the grid (orange) and solar generation (yellow).
When there is no excess solar generation exported to the grid, only the usage (blue) and solar generation (yellow) are shown.

When the amount of usage is more than the solar generation, the additional energy imported from the grid (grey) is shown as above. The solar generation (yellow) bar is also shown at the bottom of the widget next to the energy imported from the grid (grey) to indicate the percentage of solar energy relative to the amount being imported from the grid.
Tap anywhere on the medium solar widget to open the MyEnergy app Live screen.
Large Solar widget
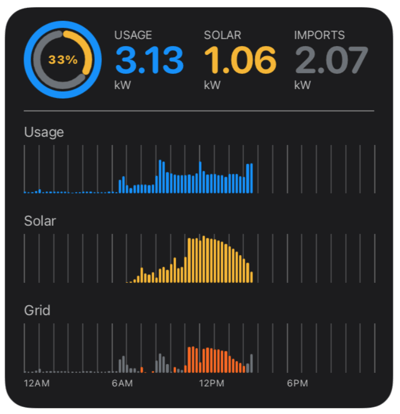

The large solar widget shows more detailed information about your solar generation in relation to usage including charts of today's usage and solar generation. The charts are shown with a simple relative scale to help you quickly understand when you generated and used the most energy.
The first row combines the information from the Small solar widget and Medium solar widget to show the rings of solar generation (yellow), usage (blue) and excess solar generation sent to the grid (orange). The current values in kW for usage (blue), solar generation (yellow) and exports to the grid (orange) are shown. Any energy imported from the grid (grey) is shown when the solar generation is lower than the total usage.
Tap anywhere on the first row of the large solar widget to open the MyEnergy app Live screen.
The middle two rows display charts of the usage (blue) and solar generation (yellow).The bottom row displays a combined chart for the net usage from grid (grey) and periods with excess solar generation sent to the grid (orange).
Tap anywhere on the charts of the large solar widget to open the corresponding detailed chart for today in the MyEnergy app History section.
The time scale of the charts is fixed for a single day between 00:00 (12 am) to 23:59 (11.59 pm). The charts will continuously update throughout the day and fill with data from left to right as the time of day passes.
Usage widgets
Small usage widget
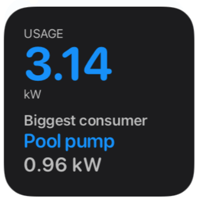

The small usage widget shows information about your current energy usage and what equipment is the biggest consumer of energy.
The total usage value in kW is displayed in the top half of the widget.
The biggest equipment category is displayed in the bottom half of the widget, including the current usage for that equipment.
Tap anywhere on the small usage widget to open the MyEnergy app Live screen.
Medium usage widget
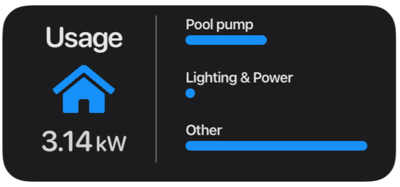

The medium usage widget shows information about your energy usage and a relative chart of the largest equipment on the property. This widget is also very similar to the Live Usage pop-up window in the app.
The left side of the widget displays the current total usage of the property in kW.
The right side of the widget displays the relative chart of the largest equipment in the property. The larger the length of the bar, the more energy that is being used by that equipment.
Tap anywhere on the medium usage widget to open the MyEnergy app Live screen.
Large usage widget
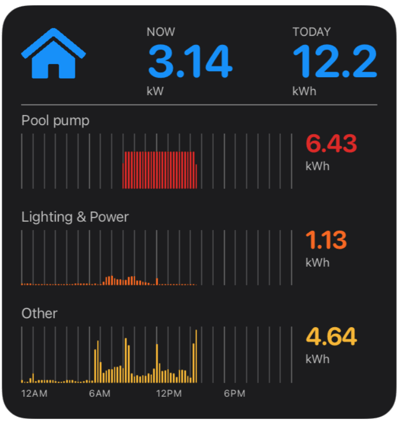

The large usage widget shows information about your energy usage with charts of the usage today for the different categories of equipment at the property. The charts are shown with a simple relative scale to help you quickly understand when you used the most energy.
The top row displays the current usage in kW and the total usage for today in kWh.
Tap anywhere on the first row of the large usage widget to open the MyEnergy app Live screen.
The bottom three rows display a chart for the usage of that equipment for the current day and the total usage for the day in kW.
Tap anywhere on the charts of the large usage widget to open the detailed Usage chart for today in the MyEnergy app History section.
The time scale of the charts is fixed for a single day between 00:00 (12 am) to 23:59 (11.59 pm). The charts will continuously update throughout the day and fill with data from left to right as the time of day passes.
Budget widgets
Note that the budget tariff rates must be entered before the budget widgets can be used. See more information on how to set up your tariff rates in the Budget section.
Small budget widget
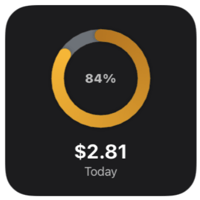
The small budget widget displays a ring chart showing the percentage of how much of your daily budget has been used as well as the current total for today.
Tap anywhere on the budget widget to open the MyEnergy app Budget screen.
Medium budget widget
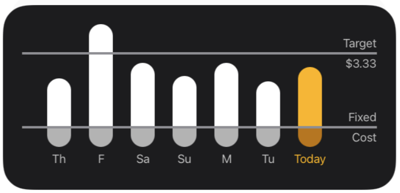
The medium budget widget allows you to see the cost of your energy relative to your budget target over the last 7 days. The bottom section below the grey Fixed Cost line shows the daily costs for supply of energy to the site. The height of each bar is then relative to the daily Target level that is shown as the upper grey line.
Tap anywhere on the budget widget to open the MyEnergy app Budget screen.
Large budget widget
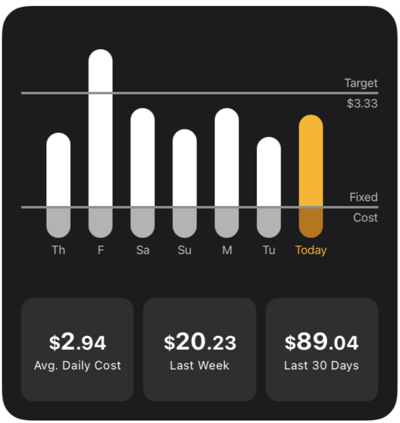
This large budget widget allows you to see the cost of your energy relative to your budget target over the last 7 days as well as the totals for the average daily cost and cost for the last week and last 30 days.
Tap anywhere on the budget widget to open the MyEnergy app Budget screen.
Widget refresh rates
Each individual widget gets the latest data approximately every 5 minutes.
Note that if you have multiple widgets open at the same time, then the values displayed on each widget may be slightly different due to the individual refresh cycle of each widget, which is controlled by the Apple iOS operating system.
MyEnergy is included in the My Energy Marketplace project that received funding from the Australian Renewable Energy (ARENA) as part of the Advancing Renewables Program. The views expressed herein are not necessarily the views of the Australian Government, and the Australian Government does not accept responsibility for any information or advice contained herein.