The web dashboard can export:
- Interval data in csv, xlsx and JSON.
- Chart Images
To download a CSV: Save as ➡️ CSV
Use the Download as option to download the chart in jpg, png or PDF.
For each date filter, the data is displayed in the following granularity and units:
|
Time span |
Interval |
Units |
|
Up to 1 day |
5 minutes |
kW |
|
1–7 days |
30 minutes |
kW |
|
8—14 days |
1 hour |
kWh |
|
15 days or more |
1 day |
kWh |
Note: Both options will download the data based on the settings for the currently visible chart.
For example, if you have selected 'Last 24 hours' in the date range filter, the individual 5 minute interval data for the past 24 hours is exported.
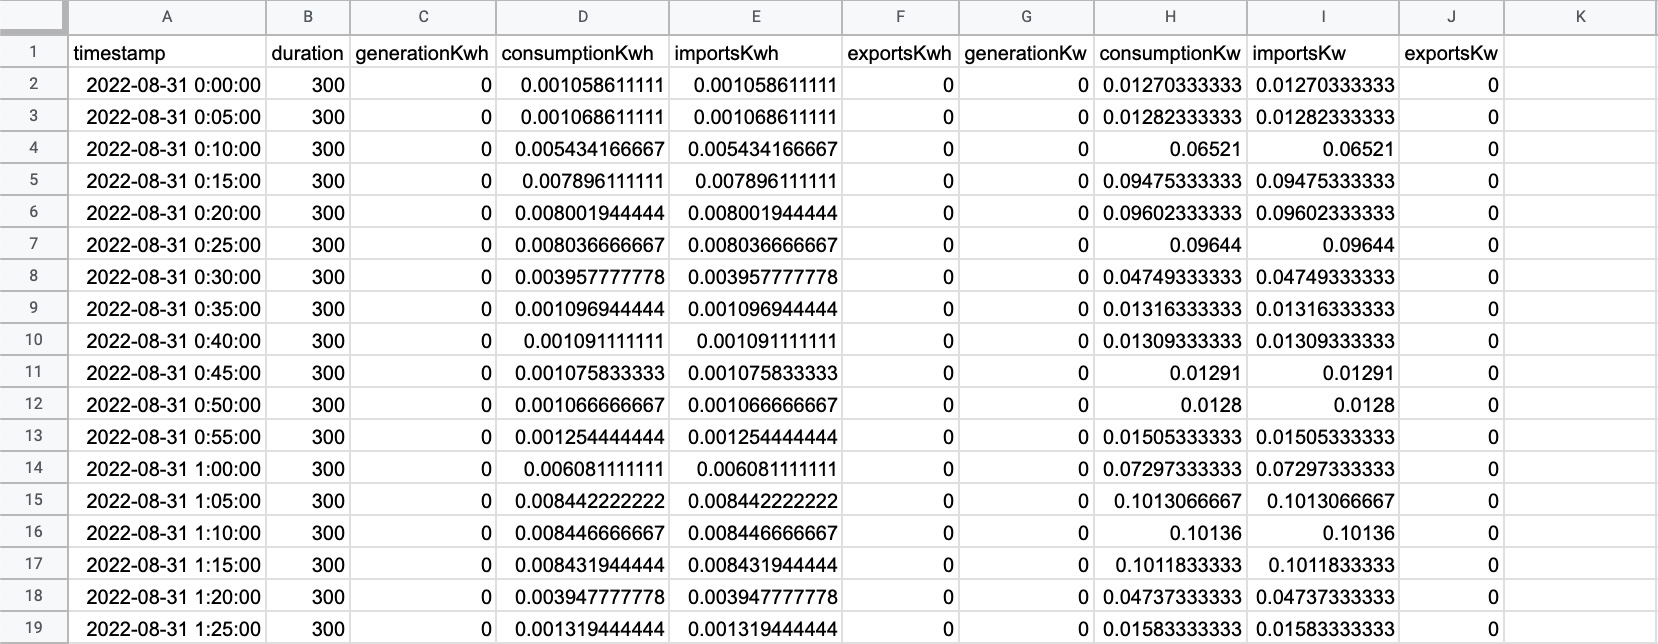
The kWh and kW data is exported using the 'Save as' function.
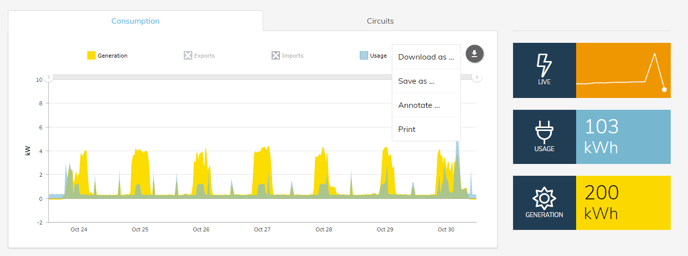
Hitting the Save as CSV while viewing the Consumption will provide you with summarise data, i.e., it provides the summary of energy generated, imported, and exported as shown in the snippet below:
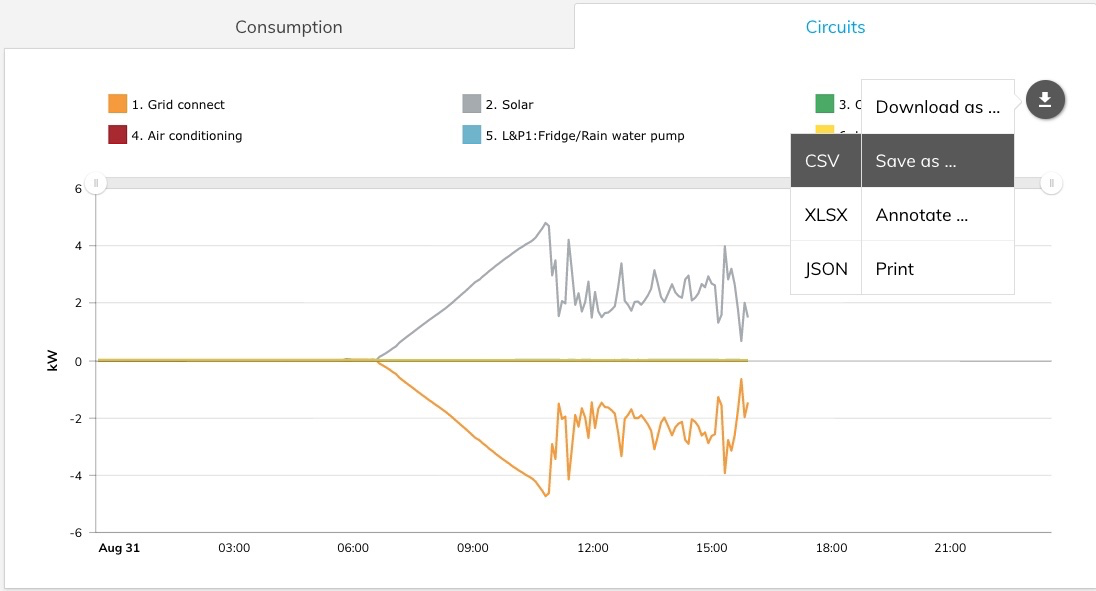
To download the energy data coming from each circuit, make sure to hit the Save as CSV button while viewing the Circuits tab as shown below:
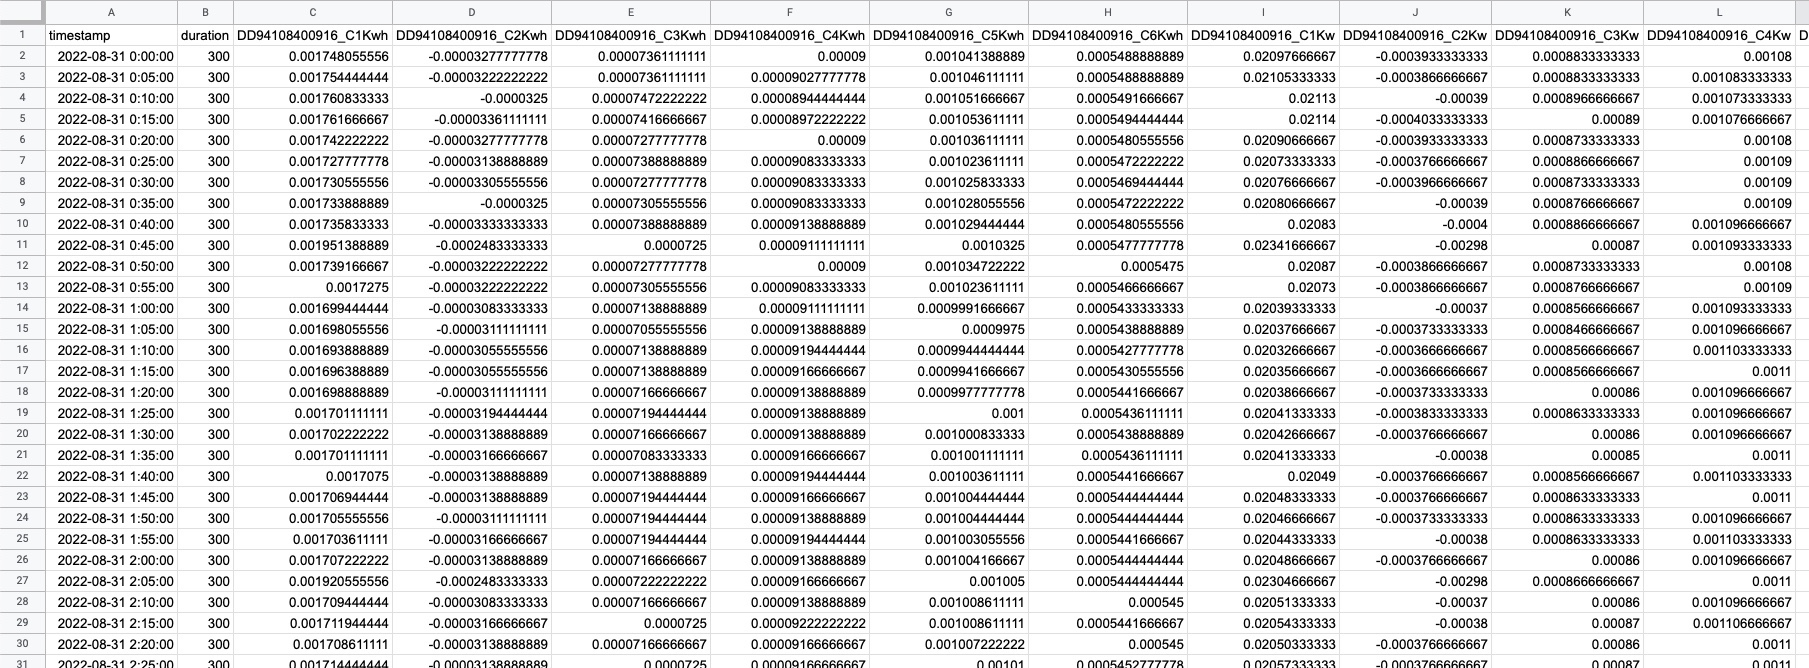
The downloaded CSV while viewing the Circuits tab should look like the following:
If the format you are seeking isn't listed in the Chart actions "Save as..." menu, the Wattwatchers API provides you with full access to the raw data coming from the device in JSON format.
While this option requires some programming knowledge, it provides a great degree of flexibility in how you can transform the data from your device. For example, you can create your own custom CSV formats, link your data with other systems, pump your data into Google Sheets (via services such as Zapier) and more.
If you would like access to the API and related documentation please contact Wattwatchers support.