This is a comprehensive user guide for the Wattwatchers Web Dashboard
It provides guidance for any dashboard user, and is arranged in these sections:
What is the Wattwatchers Web Dashboard?
Accessing the Dashboard application
How do I change the dates for which data is displayed?
How do I export/download data from the Web Dashboard?
Can I download the chart as an image?
How do I get a dashboard account?
Accessing our FAQ for the Dashboard
What is the Wattwatchers Web Dashboard?
The dashboard provides a visual way to view the data being generated by your Wattwatchers devices.
It is optimised for single-site residential households and small businesses, with or without solar generation installed.
A number of commercial customers, including those with multiple sites, also use the dashboard to access circuit-level data visualisation. But please note that it is not currently designed for multi-site use cases.
Accessing the Dashboard Application
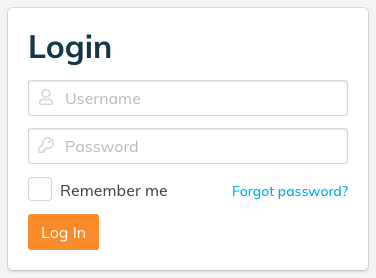
The Dashboard application is accessed from a desktop or mobile device using a web browser at Wattwatchers App.
Enter your username and password and press the Login button to access the Onboarding application. If you do not know your account credentials, you can follow the steps outlined in our Quick Answers: How do I reset my password?.
The provider of your Wattwatchers device is able to create an account for you, or you can contact Wattwatchers support to request access.
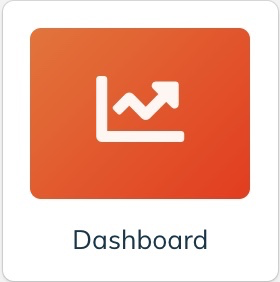
When logging in, if you have access to other Wattwatchers applications, you may be shown the application icons for Fleet, Onboarding and Dashboard. Select the Dashboard icon to continue to the Dashboard application.
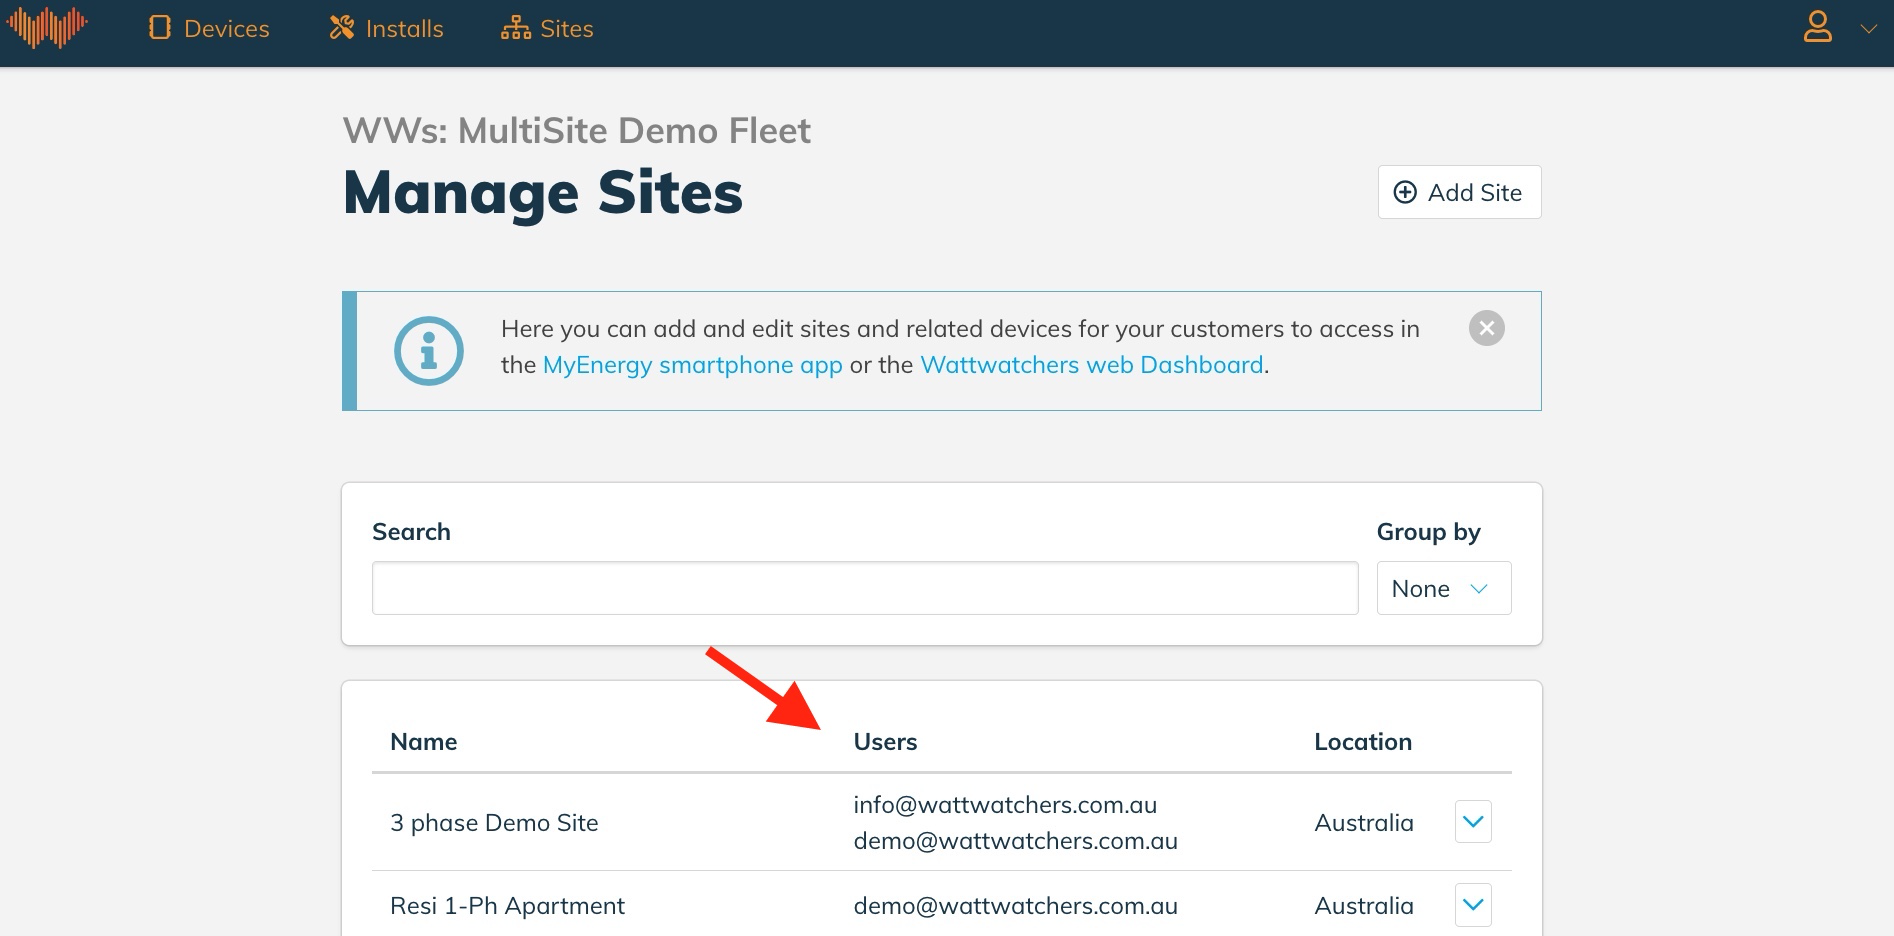
For Fleet Manager, unless your email address is listed as one of the users of the Site, you won't be able to access the Web Dashboard.
User Interface
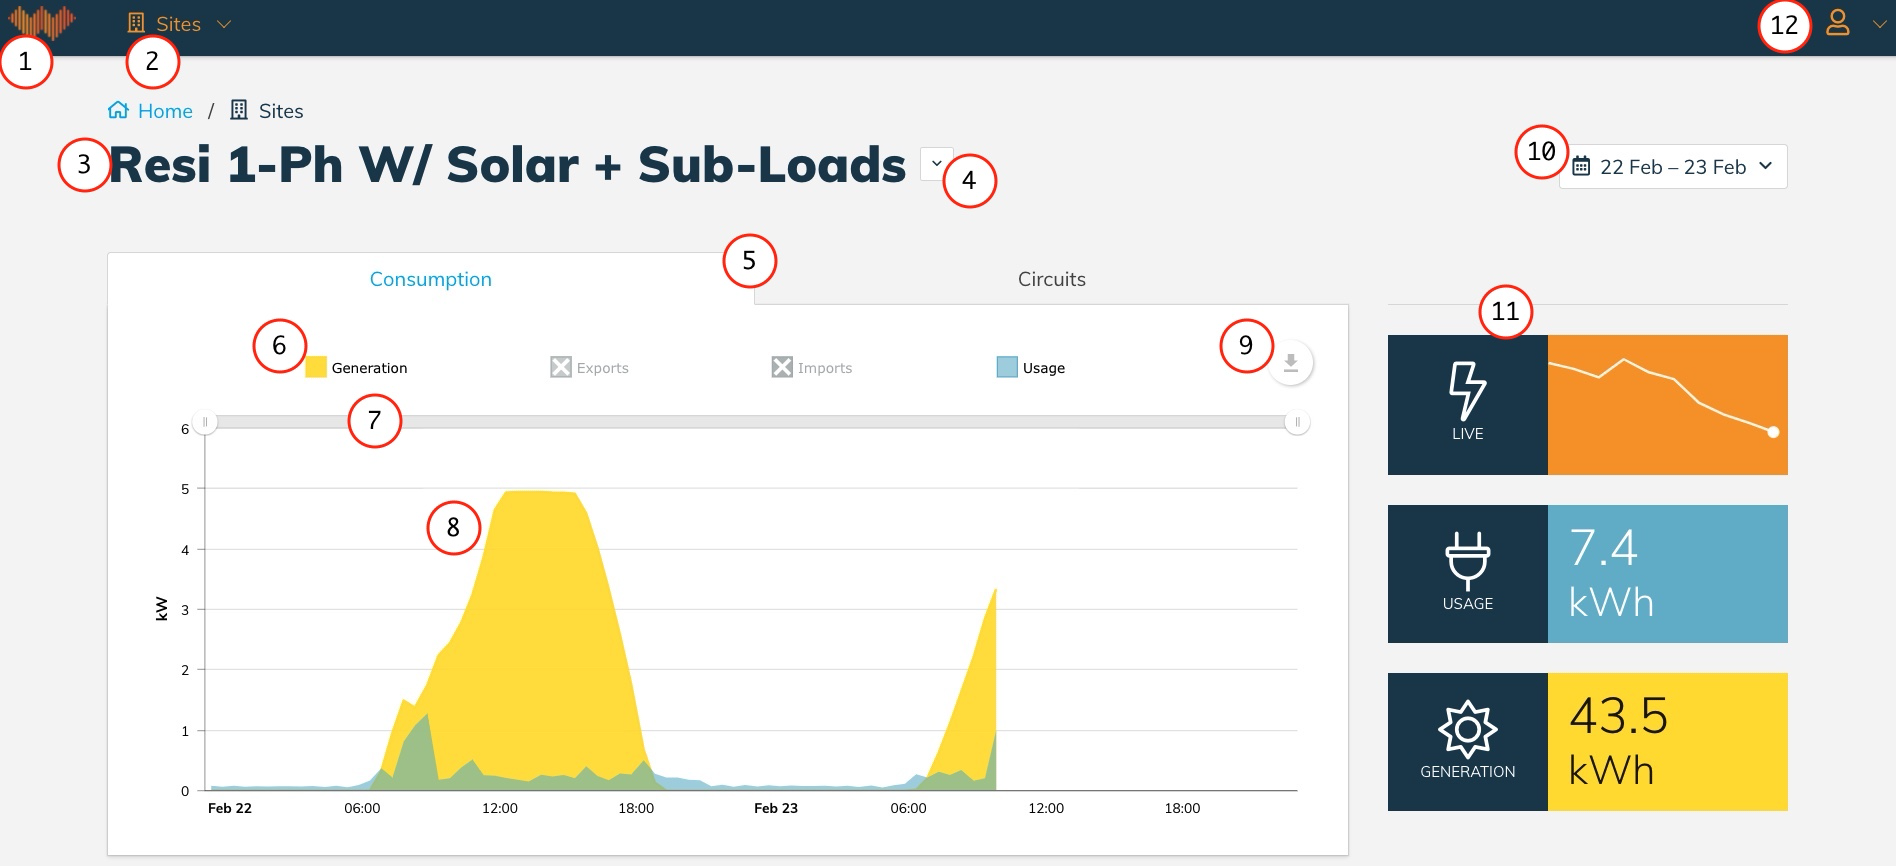
The key components of the dashboard, which are referenced later in this guide, are highlighted in the diagram below:
- Back to wattwatchers.app
- Site selection
- Site name
- Device selection
- Tabs
- Chart Legends
- Time period sliders
- Chart area
- Download menu
- Date filter
- Sidebard
- Profile/Account menu
What does the dashboard show?
Depending on your Wattwatchers device’s capabilities, and how it has been configured, you’ll have access to 2 or 3 tabs.
CONSUMPTION
For premises that have solar and are monitoring the grid connection, the Consumption tab provides a unified view that shows:
- Solar generation
- Overall energy usage
- Imports (what energy is coming from the grid)
- Exports (solar generation that is not used on-site going out to the grid)
This tab presents data from all of the devices on a site. So, for example, if you have one device monitoring your solar, and a different device monitoring your grid connection, the dashboard collates data from both devices.
This is the default view if you have configured your device with a “Grid Connect” or “Solar Generation” channel in the Installer app (Onboarding tool).
CIRCUITS
This tab shows the energy data from each of the individual channels on your Wattwatchers device.
This is the default view if there is no “Grid Connect” or “Solar Generation” channel configured for your device in the Installer app.
SWITCHES
If the device selected in the device drop-down is a switching device (e.g. an Auditor 6M+3SW or 6W+3SW), a Switches tab is displayed showing the current state of the switches on the device.
SIDEBAR
The Sidebar panels will change depending on which tab you are looking at.
All tabs include the “Live” panel, which is a “heartbeat” showing the live, 30-second data being sent by your device.

The other panels depend on your device configuration and view settings (e.g. the time period date range filter).
This may include:
- Total imports: the total kWh figure for all imports (energy drawn from the grid) in the visible period
- Total exports: the total kWh figure for all exports (energy sent to the grid, e.g. excess “Solar Generation”) in the visible period
- Total generation: the total kWh figure for the solar generated on-site (before consumption on-site or exported)
- Total usage: the total kWh figure for the energy used on-site (e.g. all solar not exported and any imports)
How does it work?
The dashboard is designed to work with Wattwatchers devices that are installed according to our standard installation guidelines, and that have been configured using our Installer app.
The Consumption tab requires that at least one of the Wattwatchers channels is assigned to the category “Grid Connect”. If there is a solar installation, another channel needs to be assigned to “Solar Generation".
If neither of these is set, the Consumption tab won’t display any data. If only one of either “Grid Connect” or “Solar Generation” is set, then only that channel will be displayed.
If your device isn’t configured correctly, please contact your installer and get them to update the settings via the Installer app.
How do I change the dates for which data is displayed?
The date range filter provides a number of “quick access” options for commonly-used time frames.
The “Today” option shows data from the start of the current day. If it is only part way through the day when you view this chart, it will appear incomplete.
The “Last 24 hours” option will display from the current time, 24 hours ago, to now.
You can also choose the “Custom…” option to specify the start and end date manually. When you use this option it displays from the start of the day in the “From” date to the end of the day in the “End” date.
How do I export/download data from the Web Dashboard?
Follow our Quick Answer for help in downloading data from the Web Dashboard.
Can I download the chart as an image?
Yes, you can. Click the Chart actions button and choose “Export > Download as…” and choose the file format that suits your requirements.
How do I get a dashboard account?
Contact the provider of your Wattwatchers device and they can create an account for you.
If you are reselling Wattwatchers and want to get set up...
